Category Archives: Climate

European Geosciences Union General Assembly 2013

I’m on my way home from my first EGU conference, taking a sleeper train from Venice to Cologne, then on to Brussels, to London via Eurostar and finally back to Bristol. It takes 23 hours with fairly slack connections. It’s a lot more civilised than flying and, especially important when attending a geoscience conference, has a lower environmental impact.

EGU2013

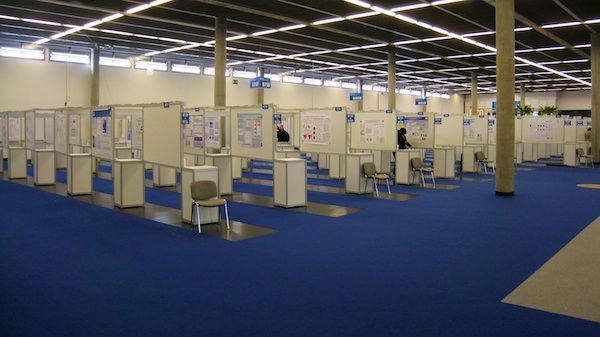
Conference Venue

My impression of the event is overwhelmingly positive. Beside the session I was involved with (CR3.2 State of the Cryosphere: Observations and Modelling) two other sessions were personal highlights. Firstly Lenny Smith’s Short Course on Predictability in Theory and Predictability in Practice. This was a 2 hour tour de force covering the development of prediction and probability applied to the modelling of dynamical systems. There are a lot of people working in geoscience today modelling dynamical systems, many could benefit from listening to Lenny’s ideas. The slide set are available here [coming soon].

Secondly, the session on Blogs and social media in scientific research. This was a panel discussion including two PhD students, a postdoc and a professor. All were passionate about blogging and tweeting their science, highlighting the many benefits; build network of contacts, raise profile, public good, improve communication skills, twitter is friendly place, can approach people, opportunity for collaboration, awareness of job opportunities, keep up with what people are doing before publications, exposure, fun, educational… but also offering some advice. Be professional – more so than in scientific life! Be measured and maintain higher ground, explain concepts carefully, invite contributions but vet them, don’t duck key issues – but don’t get drawn into unwinnable discussions, correct errors, don’t blog primary research before publication, have separate Twitter accounts for professional and personal life, think about what audience what to know and don’t tweet too much!

There are a few Twitter hash tags worth catching up on:
#EGU2013 is the main comment feed
#EGUSMEDIA for discussion arising from the blogging and social media discussion and
#EGUFrack for the fracking debate.

Videos of the press conferences are available here: http://media.egu.eu/press-conferences/

I’m in my tenth year of blogging and I’ve been tweeting for around four years. Social media has been very valuable for me. My main challenge is how to cover my science, along with beekeeping, bicycles, growing, amateur radio etc.

EGU2013 Flags

Sunny but windy on Wednesday

I attended a fairly broad range of sessions, focusing on climate, interglacial climate, arctic climate, snow and ice energy balance and ice shelves but also including energy meteorology, geoenergy and results from Mars. In addition to these conventional sessions, I also attended the great debate on shale gas: to frack or not to frack and another short course on Tipping Points in the Geosciences.

A few messages: Greenland did not contribute more than 2m of the 6-8m sea level rise during last inter-glacial according to Dorthe Dahl-Jensen’s work on the NEEM ice core. Katy Pol told us evidence from Antarctic core (EPICA Dome C) suggests a warmer climate (last interglacial) may be more variable than today’s. Contrails reduce solar power by 60% when sun blocked but small enhancement when not actually blocked, net negative effect though, P. Weihs. Alan Robock explained how a 50 nuclear bomb war between India and Pakistan would cause global cooling of ~1.5 C for a decade and devastate agriculture. 4000 bombs (most of them) would cause -8C global cooling, using nuclear weapons would be suicide through starvation/nuclear winter. F. Lott from the MetOffice used event attribution analysis to suggest the East Africa drought in 2011 was more likely as a result of anthropogenic climate change. Arctic sea ice would have reached minimum without ‘The Great Arctic Cyclone of August 2012’, Irina Rudeva. K. Kjeldsen showed how Southern Greenland been losing ice since little ice age but there’s been a factor-2 increase in loss rate in early 21st Century.

Meeting up with friends and colleagues I hadn’t seen for a couple of years was good – but especially valuable was meeting two of my co-authors for the first time. It’s great to finally meet face to face with people I’ve only been working with through email for the last few years. It’s amazing how productive ‘virtual teams’ can be but those 15 minute chats in person are invaluable.

EGU2013 Posters

Calm before the storm

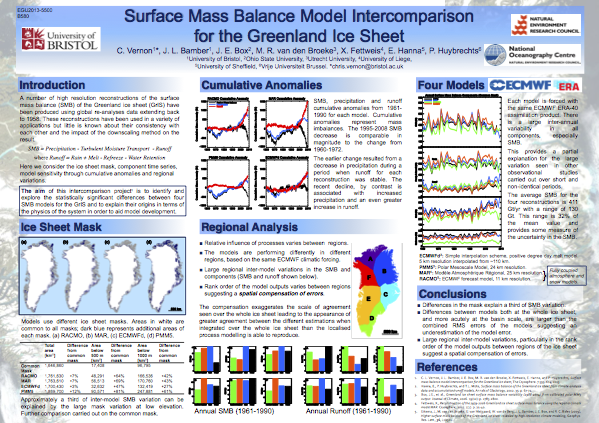
On Thursday I had a poster presentation. We had the opportunity to give a two minute ‘poster flash’ in the main oral session. This worked really well, as it gave us the chance to let everyone know who we were and the main thrust of our work. Here’s the poster I presented:

EGU Poster

Click for full size PDF

Conveniently, it’s closely related to a paper we published just a week earlier so was a great opportunity to plug the paper. It’s in a open access journel and can be accessed here:

Surface mass balance model intercomparison for the Greenland ice sheet.

Finally, I’d like to finish with a plug for the conference I’m co-organising in Edinburgh this summer. It’s the Global Energy Systems conference, a three day event examining the challenges facing our energy system in detail including supply side constraints, energy-return, renewable energy and the rate-limit of non-conventional fossil fuel. All issues that will drive future energy prices. We have a really top speaker line up including Sir David King, Lord Ron Oxburgh, Dr. Jeremy Leggett, Prof. Stuart Haszeldine, Dr. Michael Kumhof, Dr Peter Jackson and many more. We still have space for poster presentations, register here.

Recognising Reality

We have a problem. I’ve known we’ve had a problem for a long time. It’s only in the last few years though, after I left my career in engineering to take a PhD in glaciology, studying the changing Greenland ice sheet, that the magnitude and timeframe has become clear. It is now all but impossible to limit global warming, the warming of mean surface air temperature, to less than +2°C from pre-industrial temperatures [1, 2]. Understand also that temperatures over land rise more than this global average, and extremes are likely to be further exaggerated by positive feedbacks. All but impossible because to have even a fifty-fifty chance of keeping warming below that somewhat arbitrary threshold, global greenhouse gas emissions would have to peak within the next five years or so then fall rapidly for decades: “…the threshold of 2°C is no longer viable” [3].

This fall in emissions would have to happen against the trends of increasing wealth in growing economies and growing populations. Recent history, even with the largest economic slowdown in decades, offers us no hope as global emissions are currently rising faster than ever [2]. It is a fantasy to suggest that the global community is able to collectively choose to peak and decline emissions within the next few years.

The lack of action is not for lack of knowledge. The data and scientific understanding have been clear for a long time and yet over the last decade carbon emissions have increased by a greater amount than in any previous decade (between 2002 and 2011 emissions increased by 2.5 GtCyr-1 from 7.0 to 9.5 GtCyr-1 [4]). There is nothing in the data to suggest that we have recognised the seriousness of our situation. In fact the reverse is true: we are accelerating into disaster faster than the scientific community thought possible even a decade ago.

As a scientist, I’m not supposed to use emotive words like disaster; however, that is what we are facing – an avoidable disaster of our own making. Reticence amongst the scientific community has probably contributed to our civilisation’s inaction. We know enough to say, and importantly to do more. As I write this, however, my office is quiet, half empty. My colleagues are attending a conference on the other side of the planet, elevating their carbon emissions to some of the highest in the world.

Two glimmers of hope I held until recently are fading. The first was offered by researchers quantifying the Earth’s endowment of fossil fuels. Their evidence suggested there simply weren’t the hydrocarbon reserves available to greatly perturb the climate system [5]. This is the question I explored for my master’s thesis [6] a few years ago. However, as extraction of unconventional resources continues to expand and as Arctic melting unlocks probably significant northern reserves, the hope of these resource limits applying any meaningful and timely brake diminishes. Secondly, our emission growth is linked to our economic growth. Without increasing demand from the expanding wealthy population the hydrocarbon reserves will remain unexploited. The threat of economic collapse, in our case linked to unserviceable debts, is familiar and appears plausible at least for developed Western economies. Exactly three years ago I blogged, with evidence, about the economically induced 2008 emissions peak. The global economy has proved far more resilient than I imagined. In any case, were western economies to collapse, the remaining four fifths of the global population are unlikely to need asking twice before taking up any hydrocarbon supply slack and attempting to resume the emission growth trajectory.

The time for hope is over; it is simply illogical to continue believing that dangerous future climate projections can be mitigated through national and international agreements, or through pro-active action. We now have to consider life in a 4 °C warmer world, described here in a report for the World Bank [7].

Our global civilisation appears to be facing a protracted period of decline. Most likely this will be due to the damaging impacts of climate change but if, against the odds, we are spared the worst climate impacts it will only be due to decline from crippling energy shortages or global economic collapse. There is no easy way down for our seven, going on nine billion population, not from the height we’ve now reached. The first half of the 21st century is likely to represent a new peak of human civilisation, the first truly global civilisation, eclipsing our species’ many previous peaks. From here, we can only now hope the cost of climbing so high won’t be so damaging as to deny our distant descendants their own future triumphs.

—————————————————————————————————————————-
[1] PriceWaterhouseCoopers, November 2012.
Too late for two degrees? Low carbon economy index 2012.
[2] Peters, G. P., Marland, G., Le Quere, C., Boden, T., Canadell, J. G. & Raupach, M. R. 2012. Rapid growth in CO2 emissions after the 2008-2009 global financial crisis. Nature Climate Change, 2, 2-4.
[3] Anderson, K. & Bows, A. 2012. A new paradigm for climate change. Nature Climate Change, 2, 639-640.
[4] Boden, T.A., G. Marland, and R.J. Andres. 2012. Global, Regional, and National Fossil-Fuel CO2 Emissions. Carbon Dioxide Information Analysis Center, Oak Ridge National Laboratory, U.S. Department of Energy, Oak Ridge, Tenn., U.S.A. doi 10.3334/CDIAC/00001_V2012
[5] Nel, W. P. & Cooper, C. J. 2009. Implications of fossil fuel constraints on economic growth and global Warming. Energy Policy, 37, 166-180.
[6] Vernon, C., Thompson, E. & Cornell, S. 2011. Carbon dioxide emission scenarios: limitations of the fossil fuel resource. Procedia Environmental Sciences, 6, 206-215.
[7] Potsdam Institute for Climate Impact Research and Climate Analytics, November 2012. Turn Down the Heat: why a 4C warmer World Must be Avoided. Report for the World Bank.

New Scientist: Climate Change, brought to you by Statoil

New Scientist magazine are running a special feature on climate change this week. Five years on and climate change is looking worse than almost anyone projected. It’s a reasonable article, sure, there is the expected sensationalism (linking Greenland with >1m sea level rise by 2100 for example), but the general message is on the money. From Arctic sea ice through extreme weather, food production and especially human emissions the situation is deteriorating rapidly. Prof. Paul Valdes of the University of Bristol was quoted “Our emissions are not slowing, that’s the most scary aspect of our future.”. Echoing the message From University of Manchester’s Prof Kevin Anderson speaking in Bristol a few weeks ago.

The issue here is that as I read this article, on the New Scientist website, it’s surrounded by no fewer than three large adverts from Statoil. The magazine, possible even this very article is in front of me thanks to Statoil’s marketing budget – which presumably works, or they wouldn’t do it – facilitating their business. And their business in this case? Discovering and extracting new oil reserves. They are advertising for staff with the tag lines “We are looking for engineers who want to go longer, deeper and colder” and “Our megaprojects are waiting for you”. I can only assume they are talking about frontier activities, deep water or Arctic drilling.

Two problems; firstly New Scientist are part of the problem not the solution if they continue to support activities like this, providing their readership to Statoil’s HR department. Secondly, the very activity of prospecting for further hydrocarbon reserves is bankrupt. In the IEA’s World Energy Outlook 2012, published this month, they state that total carbon in known fossil fuels reserves equates to 2860 Gt CO2 if combusted, going on to say less than 900 Gt can be emitted up to 2050 for +2°C world (what they actually mean is a ~50% change of warming being less than 2°C). To put this into context, the World Meteological Organization’s Greenhouse Gas Bulletin (published this week) states 375 billion tonnes of carbon (equivalent to 1375 Gt CO2) has been emitted since 1750 and that approximately 37 Gt are being emitted annually. 24 years of current emissions uses up that 900 Gt budget, but as Valdes points out emissions are still rising with no near term peak in sight shortening this period. As I wrote earlier with regard to North Sea oil and gas “…already discovered reserves of fossil fuels are more than sufficient? If in fact it would be very unwise to burn all the current reserves, why bother looking for more?”.

StatOil

Statoil: Part of the problem

Unprecedented melting of the Greenland Ice Sheet

Last week NASA released new images of the Greenland ice sheet generated from satellite data showing that between the 8th and 12th of July 2012 the area of the ice sheet’s surface that was melting had increased from about 40 percent to an estimated 97 percent. On average during the summer approximately half of the ice sheet experiences such surface melting and this expansion of the melt area to include the highest altitude and coldest regions was described as “unprecedented” by the scientists at NASA. Such widespread melting has not been seen before during the past 34 years of satellite observations and melting at Summit Station, near the highest point on the ice sheet, has not occurred since 1889 based on ice core records.

Greenland Melt

Extent of surface melt over Greenland’s ice sheet on July 8 (left) and July 12 (right).

The Greenland ice sheet gains mass from rain and snowfall and loses mass by solid ice discharge to the ocean (iceberg calving) and runoff of surface melt water. During the period 1961-1990 these processes are thought to have been in balance with the ice sheet’s mass stable (Rignot et al., 2008). During the last two decades, however, both ice discharge and liquid runoff have increased resulting in the ice sheet losing mass over this period at an accelerating rate (Velicogna, 2009, Rignot et al., 2011). Changes to these two processes have contributed approximately equally to recent mass loss (van den Broeke et al., 2009). Whilst these NASA images do not provide data about how much snow and ice have melted or the direct effect on mass balance, they do indicate a significantly larger area of the ice sheet has been melting.

While this melting is an extreme weather event, associated with a series of unusually warm fronts passing over Greenland this summer, new research on the ice sheet’s albedo from Jason Box, a researcher with Ohio State University’s Byrd Polar Research Center, shows summer albedo has been decreasing over the last decade. This reduced reflectivity, particularly at high elevations as shown in the lower chart below, is associated with warming related feedbacks and means more energy is absorbed at the surface for melting leading Box to suggest earlier this year that it is reasonable to expect 100% melt extent within another decade of warming (Box et al., 2012).

Greenland Albedo

Greenland ice sheet reflectivity 0-3200m elevation

Greeland Albedo

Greenland ice sheet reflectivity 2500-3200m elevation

Jason’s latest albedo data are available here:
http://bprc.osu.edu/wiki/Latest_Greenland_ice_sheet_albedo.

This post was originally written for the Cabot Institute blog at The University of Bristol where two of my colleges also offer their thoughts on this melt event.

Climate Danger from Natural Gas

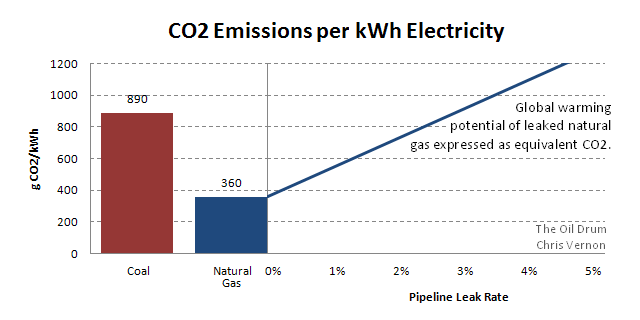
A couple of years ago I wrote a piece (Natural gas, the green choice?) for The Oil Drum looking at the climate change implications of using gas rather than coal. Burning gas to produce electricity produces only around 40% the CO2 emissions of burning coal. However, since methane (CH4) is itself a potent greenhouse gas, its release to the atmosphere without being burnt can quickly compensate for this CO2 advantage against coal. I included this chart to illustrate the point:

On the left, CO2 emissions per kWh for coal and natural gas. On the right, the global warming potential of leaked CH4 expressed as CO2

The key take-away was that if the natural gas leak rate is 3%, the global warming potential of a kilowatt-hour of electricity from gas is equivalent to coal. The details behind the chart are in the original article.

This week the journal Nature has an article (Air sampling reveals high emissions from gas field) presenting measurements from a gas field and suggesting that “Methane leaks during production may offset climate benefits of natural gas.”

Led by researchers at the National Oceanic and Atmospheric Administration (NOAA) and the University of Colorado, Boulder, the study estimates that natural-gas producers in an area known as the Denver-Julesburg Basin are losing about 4% of their gas to the atmosphere — not including additional losses in the pipeline and distribution system.

This figure of 4%, their range is 2.3–7.7% loss, with a best guess of 4%, is well inside the danger zone suggesting gas has similar, if not higher, climate impact as coal.

Most of the gas from this site is produced by “fracking”:

Most of the wells in the basin are drilled into ‘tight sand’ formations that require the same fracking technology being used in shale formations. This process involves injecting a slurry of water, chemicals and sand into wells at high pressure to fracture the rock and create veins that can carry trapped gas to the well. Afterwards, companies need to pump out the fracking fluids, releasing bubbles of dissolved gas as well as burps of early gas production. Companies typically vent these early gases into the atmosphere for up to a month or more until the well hits its full stride, at which point it is hooked up to a pipeline.

Gas is often described as the ‘cleaner’ choice, as a transitional energy source between coal and low-carbon renewables. Gas does burn without emitting the oxides of sulphur (SOx) and nitrogen (NOx), traces of mercury, selenium and arsenic, as well as the particulates associated with coal and doesn’t leave the non-combustible slag. Despite this it is increasingly unclear that gas has a significantly lower climate impact and the fracking process itself is not as clean as conventional gas extraction.

North Sea Oil, DECC and Climate Change

This week DECC (that’s the UK Government’s Department for Energy and Climate Change) opened the 27th round of offshore petroleum licensing. This is a process of offering licences for offshore oil and gas exploration and production in the UK administered part of the North Sea.

photo: Creative Commons / Genghiskhanviet

The associated press release described this as “new opportunities for UK oil and gas exploration” … which “ensures the UK gets maximum benefit from our resources.” The Energy Minister Charles Hendry said “With around 20 billion barrels of oil still to be extracted, the UK Continental Shelf has many years of productivity left.”

Given the UK’s commitment to carbon dioxide emission reductions and the global agreement to limit warming to 2°C, do we need to spend time, money and energy exploring for more oil and gas to extract from the North Sea? If the limits imposed by the Earth system and our political system’s response establish a total amount of future emissions, isn’t it quite likely that existing, already discovered reserves of fossil fuels are more than sufficient? If in fact it would be very unwise to burn all the current reserves, why bother looking for more? George Monbiot made a similar point as the Government were approving new coal mines: Leave It In The Ground

It strikes me as odd, that neither the press release nor any of the other documentation associated with this new licensing phase even mentions the carbon dioxide emissions associated with the production and inevitable combustion of the newly discovered oil and gas they are hoping for. This omission leaves DECC looking schizophrenic, with one hand attempting to meet onerous emission reductions whilst the other simultaneously desperately scratches out the last remaining fossil fuels available.

Supercomputers

So the University of Southhampton have a new Supercomputer. The BBC made a little video here:

According to the university’s page it consists of:

  • 1008 Intel Nehalem compute nodes with two 4-core processors;
  • 8064 processor-cores providing over 72 TFlops;
  • Standard compute nodes have 22 GB of RAM per node;
  • 32 high-memory nodes with 45 GB of RAM per node;
  • All nodes are connected to a high speed disk system with 110 TB of storage;

In the video Dr Oz Parchment suggests that in the world supercomputer ranking this new system would place around 83rd, interestingly he also notes that 5-6 years ago it could have been number 1. That’s the pace of computer improvement. Let’s compare with the basic office PC I’m writing this on, it cost around £600. It’s based around Intel’s Core i5-750 CPU, running at 2.66GHz. The Intel specification sheet give this CPU a floating point performance of 42.56 GFlops (billion floating point operations per second). This sounds reasonable when we consider the supercomputer with its 2016 CPUs is reported to have 72 TFlops suggesting 36 GFlops per processor. After all, Supercomputers are just large numbers of regular processors (and memory) connected together with a fast bus.

We can run Parchment’s rough calculation for my computer. How far back in time do we have to go for my standard desktop PC to be considered a supercomputer?

Since 1993 a list of the world’s fastest supercomputers has been maintained, Top 500. Going back to the beginning, we see that in 1993 a CM-5/1024 developed by Thinking Machines Corporation and owned by Los Alamos National Laboratory in the US held the top spot. This was also the computer used in the control room in the Jurassic Park film. Here’s what just a few nodes looked like, the Los Alamos system was far larger:

CM-5 Supercomputer

Thinking Machines' CM-5 Supercomputer

Being the fastest computer of it’s day it would have cost millions, been staffed by a team of engineers and scientists and been employed on the most computationally taxing investigations being carried out anywhere in the world. I expect it spent most of its time working on nuclear weapons. According to this the CM-5 cost $46k per node in 1993, which would price the Los Alamos National Laboratory system at $47 million, or around $70 million in today’s money. It’s performance? A theoretical peak of 131 GFlops, with a benchmark achieved performance of 59.7 GFlops. The same ball park as my run of the mill office computer today. It was also twice as fast as number two and ten times the power of the 20th ranked system.

What this means is that the computational resources available at the cutting edge just 17 years ago, now sit on everyone’s desk running Office 2010.

In 1997 I was lucky enough to visit the European Centre for Medium-Range Weather Forecasts (EMCWF). They had recently taken delivery of a new Fujitsu VPP700/116 and had claimed the 8th spot in the Top 500 ranking with a theoretical peak of 255.2 GFlops. The system was used for 10-day weather forecasts. This image shows a 56 node VPP700 system, the EMCWF system was ~twice the size:

Fujitsu VPP700

Fujitsu VPP700 Supercomputer

Using off the shelf components, a similarly powerful desktop computer could be built for a few thousand pounds using four Intel Xeon processors.

State of the art computer performance from a little over a decade ago, is now available to everyone able to afford a modern PC. We’re all using supercomputers. Could we be doing more with our computers than playing games and Microsoft Office 2010?

Coalition of the Willing

Back in December, after the Copenhagen climate conference I wrote a quick post about China’s awkwardness. I suggested a ‘coalition of the willing’ comprising of those governments that were willing to make emission reductions should just get on with it, without the rogue states.

Today I’ve come across Coalition of the Willing, a fantastic little film about addressing climate change without the illusive unanimous agreement between governments.

Coalition Of The Willing from coalitionfilm on Vimeo.

‘Coalition of the Willing’ is a collaborative animated film and web-based event about an online war against global warming in a ‘post Copenhagen’ world.

‘Coalition of the Willing’ has been Directed and produced by Knife Party, written by Tim Rayner and crafted by a network of 24 artists from around the world using varied and eclectic film making techniques. Collaborators include some of the world’s top moving image talent, such as Decoy, World Leaders and Parasol Island.

The film offers a response to the major problem of our time: how to galvanize and enlist the global publics in the fight against global warming. This optimistic and principled film explores how we could use new Internet technologies to leverage the powers of activists, experts, and ordinary citizens in collaborative ventures to combat climate change. Through analyses of swarm activity and social revolution, ‘Coalition of the Willing’ makes a compelling case for the new online activism and explains how to hand the fight against global warming to the people.

To find out all about the project and to join our Facebook page, follow us on Twitter, or get the iPhone App visit:
http://coalitionofthewilling.org.uk/

New UK Energy Minister and the Continuing Decline in Energy Production

This post was first published on The Oil Drum. Read there for comments.

The UK Department of Energy and Climate Change (DECC) published their quarterly Energy Trends document last week. It covers up to the first quarter 2010. The key points:

  • Total energy production in Q1 2010 was 6.5% lower than in the first quarter of 2009.
  • Oil production fell by 6% compared to the first quarter of 2009.
  • Natural gas production was 9% lower compared with the first quarter of 2009. The UK was a net importer of gas in the first quarter of 2010 by 155 TWh compared with 106 TWh in the first quarter of 2009.
  • Coal production was 12.5% lower than a year earlier.
  • Nuclear’s supply increased by 1% on the first quarter of 2009.
  • Wind, hydro and other renewables supplied 6.5% less electricity than in the same period last year, with hydro down 44% as a result of less rainfall.
  • Final energy consumption rose by 4% between the first quarter of 2009 and the first quarter of 2010, with rises in all sectors except transport which fell mainly due to the adverse weather conditions.
  • Gas demand was 13% higher than a year earlier.
  • Electricity consumption was 2.5% higher in the first quarter of 2010 compared to the same period last year.

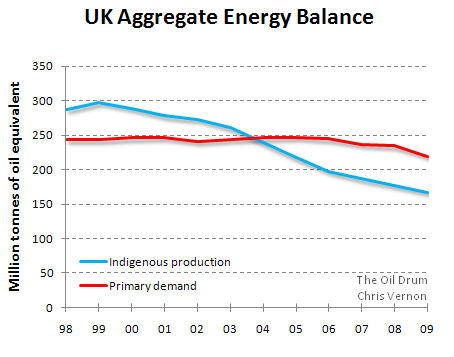
It’s a familiar story: every year the UK’s primary energy production declines significantly. Today, primary energy production is almost half what it was at the peak just a decade ago. Has any other country, let alone major economy experienced such a speed and magnitude shift in its energy system outside wartime?

The rises in the demand data above are largely due to the colder winter and a degree of recovery from the recession. One could argue the decline in indigenous production played a role in the recession. If it did, I suggest it was a small role.

UK Energy
Data from DUKES 1.1-1.3.

The annual energy deficit in 2008 was 57.5 million tonnes of oil equivalent (mtoe). That’s a lot of energy to import. The breakdown of this deficit in 2008 was 42% coal, 36% gas and 19% oil. Let’s just make a quick estimation on how much this is costing:

Fuel Percentage Deficit (mtoe) 2008 Cost/toe (£) Total Cost (£bn)
Coal 42% 24.15 115 2.77
Gas 36% 20.70 191 3.95
Oil 19% 10.92 287 3.14
Total 9.86

UK Energy Deficit 2008. Energy data from DUKES 1.1-1.3. Prices from QEP 3.2.1.

In 2008 the gap cost the UK approximately £10 bn. Fuel prices were a little lower in 2009 (especially coal and gas at -17% and -15% respectively) and the recession closed the gap from 57.5 to 53 mtoe. A few years ago the energy sector was a net source of income for the UK. No longer. The government deficit and the growing debt is receiving the media attention, this energy deficit, now it its fifth year remains largely ignored.

Following the May election, the UK now has a new Energy Minister:

Chris Huhne
Chris Huhne MP, Secretary of State for Energy and Climate Change.

On the 24 June 2010, Huhne gave a speech to the Economist UK Energy Summit, it can be watched here: VIDEO

Did he address the chart above, our energy deficit in the same way chancellor George Osborne had addressed the fiscal deficit in his emergency budget earlier in the week? Well no, not directly. Economic recovery, energy security and climate stabilisation were identified as the key challenges. He isn’t a politician to question growth but did address the type of growth. “…dependence on fossil fuel would be folly. It would make us vulnerable to oil price spikes and volatility.” He called for a decarbonised economy stimulating growth and delivering on climate change and energy security. Sounds good but surely it is having one’s cake and eating it?

After stressing the urgency and seriousness of climate change Huhne addressed energy security. “It is vital we make the most of our domestic oil and gas assets…” indicating at least 20 billion barrels oil equivalent remain in UK waters and that we must continue to invest in exploration. His first mutually exclusive objective of delivering growth through decarbonising is now joined by his second of addressing climate change whist continuing to explore for new fossil fuel resources.

£200 bn of energy investment was said to be needed over the next decade, largely to replace existing assets. On new nuclear, Huhne stressed it will go ahead, but only if it can do so with no public subsidy. In my opinion this all but rules out nuclear as there is little precedent for wholly privately funded nuclear, but we shall have to wait and see. Whatever happens, it will be late with respect to the decommissioning schedule of the existing fleet of nuclear power stations.

Efficiency was described as the fourth energy resource (relegating nuclear and renewables to 5th and 6th?)–the cheapest way of closing the energy gap between demand and supply – “the Cinderella of the energy ball”. Smart meters and grids received a nod but he focused mainly on the existing aged housing stock. “Most of the homes in use in 2050 have already been built … we used more energy heating our homes than Sweden, where average January temperatures are 7 degrees Celsius lower than ours.” Addressing existing homes will be Huhne’s flagship programme. He’s talking about insulating millions of homes. It seems the improvements will be funded at least in part through the energy savings and recovered directly from household utility bills.

“The era of cheap energy is over. …tomorrow’s energy bills will undoubtedly be higher”

When asked about the lights going out, he ruled out wind and nuclear coming to the rescue due to the timeframe, but he stated gas fired power stations can be built in 18 months and assured us the lights wouldn’t go out on his watch. Carbon capture and storage (CCS) was described as vital to meeting climate objectives whilst keeping the lights on.

So in summary, Huhne didn’t address the fundamental peaking of energy supplies which surely should be the key driver for national energy policy today. The inconsistencies of shooting for growth whilst reducing energy use along with addressing climate change (by which I can only assume he means reducing carbon emissions) while encouraging future exploration for oil and gas are glaring. Meinshausen et. al. showed in their Nature paper last year the world has more than enough proved fossil fuel reserves already from a climate change point of view without having to discover more. His enthusiasm for CCS is also worrisome and I would see as largely incompatible with energy peaking scenarios. His focus on energy efficiency and especially domestic energy use is positive though. However there was no mention of transport at all.

New government, new minister but we still seem little closer to recognising the challenges ahead.

Natural gas, the green(er) choice?

This post was first published on The Oil Drum. Read there for 100+ comments.

Natural gas is regarded as a relatively environmentally friendly way of generating electricity. Gas burns cleanly without many of the problems associated with coal. Coal is a chemically complex substance. When it is is burnt, it releases oxides of sulphur (SOx) and nitrogen (NOx), traces of mercury, selenium and arsenic, as well as particulates, and a non-combustible slag remains after burning. Coal mining is also a dirty and dangerous job.

Coal emits considerably more CO2 than natural gas per unit energy. However, natural gas (CH4) itself is a potent greenhouse gas, and its release to the atmosphere without being burnt can quickly compensate for the CO2 advantage against coal.

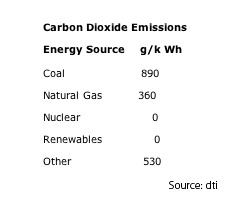
Generating electricity from fossil fuels typically involves their combustion in large power stations. Due to the molecular differences of coal, oil and gas, different amounts of carbon dioxide are produced for each unit of thermal energy. For example, the EIA tells us coal (anthracite) releases 227 pounds of CO2 per million BTU (or 351 g/kWh thermal), fuel oil or diesel 161 lb/MBTU (249 g/kWh) and natural gas releases 115 lb/MBTU (178 g/kWh). This, coupled with the variability in power station thermal efficiency leads to significant variations in the amount of CO2/kWh of electricity emitted.

The figures below are for the UK electricity grid.


This table was lifted from: http://electricityinfo.org/co2emissions.php

These CO2 emissions are directly related to the fossil fuel combustion and power station efficiency. Lifecycle emissions are not included, leaving nuclear and renewables at zero, because emissions related to construction, decommissioning, uranium processing etc. are ignored. Natural gas is considered the ‘greener’ fuel as electricity from gas emits 2.5 times less CO2 than coal, as well dramatically lower CO, NOx and virtually no SOx or particulates.

There is an issue of system boundaries here. The figures above only consider the power station and not any upstream supply system. While CH4 may leak from the gas pipelines, there are also CH4 releases from coal mines. For this post, let’s consider emissions after the mine mouth or well head, and ignore emissions associated with transporting coal.

For oil and coal, the only significant route into the atmosphere is via combustion. However, besides being burnt, natural gas can be released without combustion as methane, CH4. This becomes interesting when one considers both the impact of atmospheric emissions of CO2 and CH4. Both are greenhouse gases in that they that absorb and emit radiation within the thermal infrared range of the electromagnetic spectrum, however their respective radiative forcings are very different. The radiative forcing measures how much a greenhouse gas (or other factors) alters the balance of incoming and outgoing energy in the Earth-atmosphere system.

The Carbon Dioxide Information Analysis Center (CDIAC) part of the US Dept. of Energy uses Global Warming Potential (GWP), as it provides a simple measure of the radiative effects of emissions of various greenhouse gases, integrated over a specified time horizon and relative to an equal mass of CO2 emissions. Over a common 100 year time horizon CDIAC state the global warming potential of CH4 as 25 times greater than CO2 [link]. The calculation is not trivial, and estimations do vary a little, but for this analysis the factor 25 is sufficient.

We saw above that natural gas emits 2.5 times less CO2 than coal when used to generate electricity. However, when CH4 is released to the atmosphere without first being combusted, the global warming potential is 25 times higher than CO2. It is a more potent greenhouse gas. If only a little natural gas is released without being burnt, it will dominate the radiative forcing and more than compensate for the 2.5-fold advantage gas has over coal.

The chart illustrates this effect:


On the left, CO2 emissions per kWh for coal and natural gas. On the right, the global warming potential of leaked CH4 expressed as CO2

If the natural gas leak rate is 3%, the global warming potential of a kilowatt-hour of electricity from gas is equivalent to coal.

Leak Rates

So what are pipeline leak rates? A 1997 US Environmental Protection Agency report states US methane leak rates were 1.4 +/- 0.5 % in 1992. The largest source of leakage at that time was compressor components used in the processing, transmission, and storage, followed by the distribution network itself, with the small length of old cast iron pipes leaking disproportionately highly. The natural gas production process also contributes through millions of slowly leaking pneumatic control devices. A larger study carried out from 2005 by Brazil’s largest gas distributer Comgas suggests cast iron pipe leak rates double the EPA study.

A 1990 study for Greenpeace considered the UK distribution network then operated by British Gas. Greenpeace estimated low, medium and high scenario leakage rates of 1.9%, 5.3% and 10.8% respectively. This was in contrast to the 1% claimed by British Gas at the time. The authors were confident leakage rates were above 1.9%. These figures are likely obsolete today as there still existed a large amount of pre-1970 cast iron pipe work, much of it since replaced. In 1990 only 39% of the UK mains and 74% of the service pipes were plastic.

The 1.4% figure is also old, and only refers to the US, but it is a significant magnitude, it represents a 70% increase in global warming potential compared to the CO2 alone and halves the CO2 advantage gas has over coal based on the 360 and 890 g/kWh figures above.

Whilst these figures do not tip gas beyond coal, they halve its advantage. They are also only national. For the US this is quite understandable, but for the UK and Europe, the gas system is changing. Could leak rates become important as natural gas supply routes become longer? As Europe increases its reliance on Russia, as previously stranded gas is brought to market through longer pipelines than before, as a larger number of smaller deposits are exploited and as existing infrastructure ages, it seems likely that leak rates will increase. We often hear about struggles in the former Soviet states related to gas – is the leak rate there one percent or five? Is it economically feasible for the pipeline operator to make investments to stem the last percentage point of a system’s leaks?

Is it possible that a ‘green’ gas power station in the UK is making a greater contribution to global warming than one burning coal?

Does anyone have recent data on leakage rates, especially for Russia and Eastern Europe?