Category Archives: Greenland

European Geosciences Union General Assembly 2013

I’m on my way home from my first EGU conference, taking a sleeper train from Venice to Cologne, then on to Brussels, to London via Eurostar and finally back to Bristol. It takes 23 hours with fairly slack connections. It’s a lot more civilised than flying and, especially important when attending a geoscience conference, has a lower environmental impact.

EGU2013

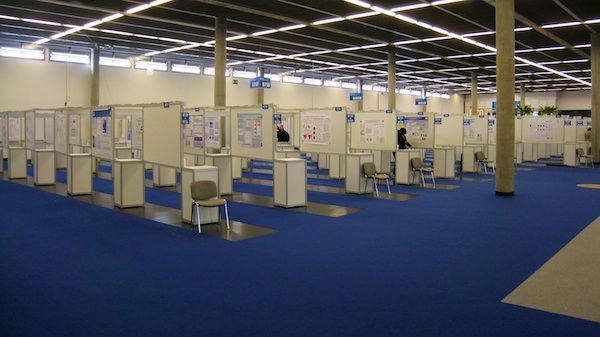
Conference Venue

My impression of the event is overwhelmingly positive. Beside the session I was involved with (CR3.2 State of the Cryosphere: Observations and Modelling) two other sessions were personal highlights. Firstly Lenny Smith’s Short Course on Predictability in Theory and Predictability in Practice. This was a 2 hour tour de force covering the development of prediction and probability applied to the modelling of dynamical systems. There are a lot of people working in geoscience today modelling dynamical systems, many could benefit from listening to Lenny’s ideas. The slide set are available here [coming soon].

Secondly, the session on Blogs and social media in scientific research. This was a panel discussion including two PhD students, a postdoc and a professor. All were passionate about blogging and tweeting their science, highlighting the many benefits; build network of contacts, raise profile, public good, improve communication skills, twitter is friendly place, can approach people, opportunity for collaboration, awareness of job opportunities, keep up with what people are doing before publications, exposure, fun, educational… but also offering some advice. Be professional – more so than in scientific life! Be measured and maintain higher ground, explain concepts carefully, invite contributions but vet them, don’t duck key issues – but don’t get drawn into unwinnable discussions, correct errors, don’t blog primary research before publication, have separate Twitter accounts for professional and personal life, think about what audience what to know and don’t tweet too much!

There are a few Twitter hash tags worth catching up on:
#EGU2013 is the main comment feed
#EGUSMEDIA for discussion arising from the blogging and social media discussion and
#EGUFrack for the fracking debate.

Videos of the press conferences are available here: http://media.egu.eu/press-conferences/

I’m in my tenth year of blogging and I’ve been tweeting for around four years. Social media has been very valuable for me. My main challenge is how to cover my science, along with beekeeping, bicycles, growing, amateur radio etc.

EGU2013 Flags

Sunny but windy on Wednesday

I attended a fairly broad range of sessions, focusing on climate, interglacial climate, arctic climate, snow and ice energy balance and ice shelves but also including energy meteorology, geoenergy and results from Mars. In addition to these conventional sessions, I also attended the great debate on shale gas: to frack or not to frack and another short course on Tipping Points in the Geosciences.

A few messages: Greenland did not contribute more than 2m of the 6-8m sea level rise during last inter-glacial according to Dorthe Dahl-Jensen’s work on the NEEM ice core. Katy Pol told us evidence from Antarctic core (EPICA Dome C) suggests a warmer climate (last interglacial) may be more variable than today’s. Contrails reduce solar power by 60% when sun blocked but small enhancement when not actually blocked, net negative effect though, P. Weihs. Alan Robock explained how a 50 nuclear bomb war between India and Pakistan would cause global cooling of ~1.5 C for a decade and devastate agriculture. 4000 bombs (most of them) would cause -8C global cooling, using nuclear weapons would be suicide through starvation/nuclear winter. F. Lott from the MetOffice used event attribution analysis to suggest the East Africa drought in 2011 was more likely as a result of anthropogenic climate change. Arctic sea ice would have reached minimum without ‘The Great Arctic Cyclone of August 2012’, Irina Rudeva. K. Kjeldsen showed how Southern Greenland been losing ice since little ice age but there’s been a factor-2 increase in loss rate in early 21st Century.

Meeting up with friends and colleagues I hadn’t seen for a couple of years was good – but especially valuable was meeting two of my co-authors for the first time. It’s great to finally meet face to face with people I’ve only been working with through email for the last few years. It’s amazing how productive ‘virtual teams’ can be but those 15 minute chats in person are invaluable.

EGU2013 Posters

Calm before the storm

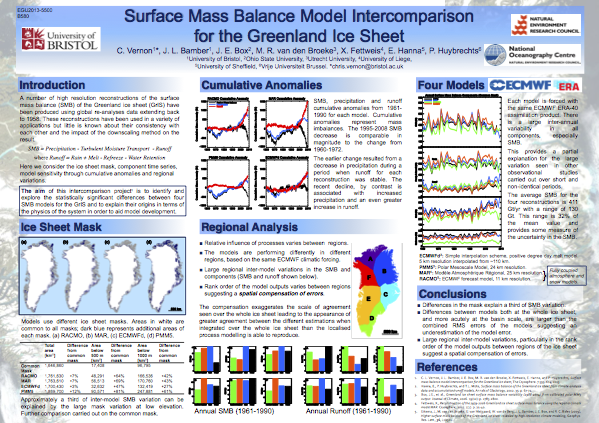
On Thursday I had a poster presentation. We had the opportunity to give a two minute ‘poster flash’ in the main oral session. This worked really well, as it gave us the chance to let everyone know who we were and the main thrust of our work. Here’s the poster I presented:

EGU Poster

Click for full size PDF

Conveniently, it’s closely related to a paper we published just a week earlier so was a great opportunity to plug the paper. It’s in a open access journel and can be accessed here:

Surface mass balance model intercomparison for the Greenland ice sheet.

Finally, I’d like to finish with a plug for the conference I’m co-organising in Edinburgh this summer. It’s the Global Energy Systems conference, a three day event examining the challenges facing our energy system in detail including supply side constraints, energy-return, renewable energy and the rate-limit of non-conventional fossil fuel. All issues that will drive future energy prices. We have a really top speaker line up including Sir David King, Lord Ron Oxburgh, Dr. Jeremy Leggett, Prof. Stuart Haszeldine, Dr. Michael Kumhof, Dr Peter Jackson and many more. We still have space for poster presentations, register here.

New Scientist: Climate Change, brought to you by Statoil

New Scientist magazine are running a special feature on climate change this week. Five years on and climate change is looking worse than almost anyone projected. It’s a reasonable article, sure, there is the expected sensationalism (linking Greenland with >1m sea level rise by 2100 for example), but the general message is on the money. From Arctic sea ice through extreme weather, food production and especially human emissions the situation is deteriorating rapidly. Prof. Paul Valdes of the University of Bristol was quoted “Our emissions are not slowing, that’s the most scary aspect of our future.”. Echoing the message From University of Manchester’s Prof Kevin Anderson speaking in Bristol a few weeks ago.

The issue here is that as I read this article, on the New Scientist website, it’s surrounded by no fewer than three large adverts from Statoil. The magazine, possible even this very article is in front of me thanks to Statoil’s marketing budget – which presumably works, or they wouldn’t do it – facilitating their business. And their business in this case? Discovering and extracting new oil reserves. They are advertising for staff with the tag lines “We are looking for engineers who want to go longer, deeper and colder” and “Our megaprojects are waiting for you”. I can only assume they are talking about frontier activities, deep water or Arctic drilling.

Two problems; firstly New Scientist are part of the problem not the solution if they continue to support activities like this, providing their readership to Statoil’s HR department. Secondly, the very activity of prospecting for further hydrocarbon reserves is bankrupt. In the IEA’s World Energy Outlook 2012, published this month, they state that total carbon in known fossil fuels reserves equates to 2860 Gt CO2 if combusted, going on to say less than 900 Gt can be emitted up to 2050 for +2°C world (what they actually mean is a ~50% change of warming being less than 2°C). To put this into context, the World Meteological Organization’s Greenhouse Gas Bulletin (published this week) states 375 billion tonnes of carbon (equivalent to 1375 Gt CO2) has been emitted since 1750 and that approximately 37 Gt are being emitted annually. 24 years of current emissions uses up that 900 Gt budget, but as Valdes points out emissions are still rising with no near term peak in sight shortening this period. As I wrote earlier with regard to North Sea oil and gas “…already discovered reserves of fossil fuels are more than sufficient? If in fact it would be very unwise to burn all the current reserves, why bother looking for more?”.

StatOil

Statoil: Part of the problem

Unprecedented melting of the Greenland Ice Sheet

Last week NASA released new images of the Greenland ice sheet generated from satellite data showing that between the 8th and 12th of July 2012 the area of the ice sheet’s surface that was melting had increased from about 40 percent to an estimated 97 percent. On average during the summer approximately half of the ice sheet experiences such surface melting and this expansion of the melt area to include the highest altitude and coldest regions was described as “unprecedented” by the scientists at NASA. Such widespread melting has not been seen before during the past 34 years of satellite observations and melting at Summit Station, near the highest point on the ice sheet, has not occurred since 1889 based on ice core records.

Greenland Melt

Extent of surface melt over Greenland’s ice sheet on July 8 (left) and July 12 (right).

The Greenland ice sheet gains mass from rain and snowfall and loses mass by solid ice discharge to the ocean (iceberg calving) and runoff of surface melt water. During the period 1961-1990 these processes are thought to have been in balance with the ice sheet’s mass stable (Rignot et al., 2008). During the last two decades, however, both ice discharge and liquid runoff have increased resulting in the ice sheet losing mass over this period at an accelerating rate (Velicogna, 2009, Rignot et al., 2011). Changes to these two processes have contributed approximately equally to recent mass loss (van den Broeke et al., 2009). Whilst these NASA images do not provide data about how much snow and ice have melted or the direct effect on mass balance, they do indicate a significantly larger area of the ice sheet has been melting.

While this melting is an extreme weather event, associated with a series of unusually warm fronts passing over Greenland this summer, new research on the ice sheet’s albedo from Jason Box, a researcher with Ohio State University’s Byrd Polar Research Center, shows summer albedo has been decreasing over the last decade. This reduced reflectivity, particularly at high elevations as shown in the lower chart below, is associated with warming related feedbacks and means more energy is absorbed at the surface for melting leading Box to suggest earlier this year that it is reasonable to expect 100% melt extent within another decade of warming (Box et al., 2012).

Greenland Albedo

Greenland ice sheet reflectivity 0-3200m elevation

Greeland Albedo

Greenland ice sheet reflectivity 2500-3200m elevation

Jason’s latest albedo data are available here:
http://bprc.osu.edu/wiki/Latest_Greenland_ice_sheet_albedo.

This post was originally written for the Cabot Institute blog at The University of Bristol where two of my colleges also offer their thoughts on this melt event.