Category Archives: Weather

Supercomputers

So the University of Southhampton have a new Supercomputer. The BBC made a little video here:

According to the university’s page it consists of:

  • 1008 Intel Nehalem compute nodes with two 4-core processors;
  • 8064 processor-cores providing over 72 TFlops;
  • Standard compute nodes have 22 GB of RAM per node;
  • 32 high-memory nodes with 45 GB of RAM per node;
  • All nodes are connected to a high speed disk system with 110 TB of storage;

In the video Dr Oz Parchment suggests that in the world supercomputer ranking this new system would place around 83rd, interestingly he also notes that 5-6 years ago it could have been number 1. That’s the pace of computer improvement. Let’s compare with the basic office PC I’m writing this on, it cost around £600. It’s based around Intel’s Core i5-750 CPU, running at 2.66GHz. The Intel specification sheet give this CPU a floating point performance of 42.56 GFlops (billion floating point operations per second). This sounds reasonable when we consider the supercomputer with its 2016 CPUs is reported to have 72 TFlops suggesting 36 GFlops per processor. After all, Supercomputers are just large numbers of regular processors (and memory) connected together with a fast bus.

We can run Parchment’s rough calculation for my computer. How far back in time do we have to go for my standard desktop PC to be considered a supercomputer?

Since 1993 a list of the world’s fastest supercomputers has been maintained, Top 500. Going back to the beginning, we see that in 1993 a CM-5/1024 developed by Thinking Machines Corporation and owned by Los Alamos National Laboratory in the US held the top spot. This was also the computer used in the control room in the Jurassic Park film. Here’s what just a few nodes looked like, the Los Alamos system was far larger:

CM-5 Supercomputer

Thinking Machines' CM-5 Supercomputer

Being the fastest computer of it’s day it would have cost millions, been staffed by a team of engineers and scientists and been employed on the most computationally taxing investigations being carried out anywhere in the world. I expect it spent most of its time working on nuclear weapons. According to this the CM-5 cost $46k per node in 1993, which would price the Los Alamos National Laboratory system at $47 million, or around $70 million in today’s money. It’s performance? A theoretical peak of 131 GFlops, with a benchmark achieved performance of 59.7 GFlops. The same ball park as my run of the mill office computer today. It was also twice as fast as number two and ten times the power of the 20th ranked system.

What this means is that the computational resources available at the cutting edge just 17 years ago, now sit on everyone’s desk running Office 2010.

In 1997 I was lucky enough to visit the European Centre for Medium-Range Weather Forecasts (EMCWF). They had recently taken delivery of a new Fujitsu VPP700/116 and had claimed the 8th spot in the Top 500 ranking with a theoretical peak of 255.2 GFlops. The system was used for 10-day weather forecasts. This image shows a 56 node VPP700 system, the EMCWF system was ~twice the size:

Fujitsu VPP700

Fujitsu VPP700 Supercomputer

Using off the shelf components, a similarly powerful desktop computer could be built for a few thousand pounds using four Intel Xeon processors.

State of the art computer performance from a little over a decade ago, is now available to everyone able to afford a modern PC. We’re all using supercomputers. Could we be doing more with our computers than playing games and Microsoft Office 2010?

High Tide Alert

Tides can be fairly dramatic, within hours the sea rises and falls several metres. Without them beaches would be a lot smaller. They are caused by the gravitational pull of the Moon and the Sun exerting a force on the water (and the Earth), first one way, and then the other. Twice each lunar month the Sun and Moon become aligned and both pull in the same direction, reinforcing each other creating a spring tide (not named after the season!). More rarely this reinforcement coincides with the Moon’s closest approach, the perigee of the elliptical orbit producing a higher spring tide called a perigean spring tide. The highest tides occur when the spring tide coincides with one of the solar equinoxes to produce a equinoctial tide.

I’m writing this on the evening for Friday 26th February after my father sent me a couple of web links. The first link was from the Proudman Oceanographic Laboratory in Liverpool and showed the tide table for the port of Immingham, about half way up the English east coast. The data is presented below. It shows a twice yearly high equinoctial tide is on the way (2nd highest of the year), with the highest height of 7.86 m due on the evening of Tue 2nd of March. The peaks on the 1st and 3rd are only ~10cm lower.

Immingham tide table

Immingham tide table. Proudman Oceanographic Laboratory.

The tides in the first link do not take weather into consideration. The actual height of the water on any given day is highly influenced by the strength and direction of the wind and the air pressure. Low pressure allows the sea to bulge up, high pressure depresses it. For every millibar decrease in air pressure, sea level rises by 1 cm, a deep 960 mb low raises sea level by half a meter from the average pressure of around 1013 mb (Met Office). Wind strength and direction has a greater impact though. Strong winds can push water towards the shore or funnel it into narrowing coastal features causing the tide to be higher than it would otherwise be.

The second link is where it gets interesting. It is a surface pressure forecast from the UK Met Office. As of this evening the T+72 hr chart which represents 0000h Mon 1st of March shows a low pressure area (~972 mb) in the southern portion of the North Sea. A first approximation suggests this represents a ~40 cm rise on top of the spring tide. I’ve reproduced the chart below. Clicking forward to 1200h on the Monday shows the low pressure area tracking a little eastwards.

Surface Pressure Forecast

Surface pressure forecast as of 26th Feb 2010.

The thing to remember about low pressure systems, or cyclones, is that the winds blow around them in an anti-clockwise direction (in the Northern Hemisphere). This means that, according to my crude interpretation of the surface pressure chart we can expect the winds to be blowing either towards the coast or perhaps more seriously down the North Sea from the north east funnelling water southwards. This wind and pressure system look to be reinforcing the spring tide and could result in an exceptionally high tide next week.

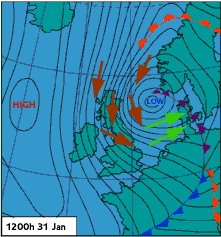
Disclaimer: I am no expert in this kind of analysis. This short post represents the limit of my understanding and three days out the track and intensity of this low pressure system could change significantly. However it’s worth remembering that the disastrous North Sea flood of 31 Jan – 1 Feb 1953 where 1,835 people were killed in the Netherlands and 307 in the UK, followed a similar combination of spring tide reinforced by a low pressure system. In that event the pressure was a little lower, dipping to 966 mb and the centre approached from the north (pulling water with it) rather than the south as is the case today. An additional contributing factor in 1953 was a ridge of high pressure (1030 mb) south of Iceland, the large pressure gradient driving high winds (Met Office). Today there is no such high and very strong winds seen in 1953 are not expected. It should also be noted that sea defences both in the UK and the Netherlands are considerably better than in 1953, an identical meteorological event should not be as dangerous today.

Presure 31 Jan 1953

Pressure system hours before the 1953 flood, low 966 mb.

In summary, it should be a very high tide on the East coast next week but the forecast as it stands tonight does not suggest a dangerous event.