Category Archives: Energy

Solar PV Water Heater Challenge

The Challenge
To ‘dump’ as much excess solar photovoltaic energy into hot water tank as possible whilst minimising impact on battery store.

Background
Our house is off-grid, powered by 6.5 kWp solar photovoltaics and a wood stove with back boiler. Being off-grid, we can’t export electricity so it either has to be used as it’s being generated or stored in batteries. Once the batteries are full, it’s a case of use it or lose it. We want to store this otherwise lost energy as heat our hot water tank.

Equipment
2x Victron BlueSolar MPPT 150/70
BMV-702
Colour Control GX
2x Phoenix Inverter 3000VA
360 Copper Thermal Store with 3x 2.25” immersion heater bosses
22kWh 48V Lead acid battery store

First question AC or DC. I think it’s better to use 48V DC immersion heater(s) so as not to use the inverters unnecessarily or even keep them on all the time (we have a smaller 1.2 kVA inverter which is on all the time). The thermal store is only about 10m from the battery store so cabling is not unreasonable.

Relays
The MPPT, BMV and CCGX all have relays with the following options available:

BlueSolar MPPT

BMV-702


Colour Control GX
Has a relay, but can only work on information provided by the other devices so maybe there’s no point in using it? However, it does have a neat way to start/stop a generator, track hours run etc. I wonder if this assistant could be used to start/stop the immersion heaters?
https://www.victronenergy.com/live/ccgx:generator_start_stop

I don’t yet own the 48V immersion heaters, but say I get 3x 1.5kW for 4.5kW total. These could take a single cable then be hooked up in parallel at the water tank. This would be around 90A, over 10m so 14mm2 (6 AWG) for a 5% voltage drop. That’s some thick cable, and a single on/off or 4.5kW is not very delicate! Maybe better to run a separate cable to each immersion (more manageable 4.5mm (11 AWG) and have the choice of 1.5, 3 or 4.5 kW depending on how much excess solar was incoming.

Questions
Which relay(s) to use?
What to trigger on?
Relay minimum close time?
Is there a way of varying the power to the heaters, such that if there’s only 500W of ‘spare’ solar, that’s all that’ll get dumped?

My initial thought was to use the MPPT’s float option. Something like when the controller enters float, close the relay for 30 minutes. But this misses a lot of energy in the absorption stage before the batteries have reached float and there’s the risk of switching on the heaters late in the afternoon, when float has just been reached but there isn’t a large surplus. So maybe the BMV’s state or charge or battery voltage are better triggers? Battery voltage is at it’s highest during the absorption stage though so any high voltage trigger would switch on before the batteries are full?

I’ll also need high current DC-DC relays, something like this?
D06D100 – Solid State Relay, SPST-NO, 100 A, 60 VDC, Panel, Screw, DC Switch
http://uk.farnell.com/crydom/d06d100/ssr-100a-3-5-32vdc-0-60vdc/dp/1213166
Anything better/cheaper?

High Speed 2

High Speed 2
I have just one simple response to High Speed 2 (HS2). Why do we need to invest a lot of money, many billions, in further facilitating long distance national travel? This seems like a bad idea. We would be better served by re-engineering the country and economy to reduce our need and indeed our desire for long distance travel.

We’d do well to focus on the Proximity Principle as described by Dr David Fleming in Lean Logic. The principle states that the need for transport is reduced by using space more intelligently, producing goods and services – especially food – where they are needed, rather than having to transport them over long distances. The objective is to build competence across the whole range of economics and culture, and to enable personal lives to be organised so that routine travel and transport are no longer a necessary condition for material needs, nor for leisure, friendships and work.

The HS2 proposal misses this entirely, it seems to be based on the single, dumb, assumption that there’ll be more travelling in the future. To what end? I and I expect most others don’t want to travel more. In fact what we’d all really like to do is to meet all our needs as, Fleming describes above, without having to spend good time, and good money travelling.

Sadly, HS2 is another case of treating the symptoms, not the disease. Something to which transport policy is particularly susceptible.

The unanswerable question at the heart of transport is the one asked by the farm labourer standing bemused one day in the mid-eighteenth century at the side of the Liverpool-Manchester turnpike, crowded with urgently-speeding coaches: “Who would ever have thought that there were so many people in the wrong place?”
From Lean Logic ~ David Fleming 1940-2010

New Scientist: Climate Change, brought to you by Statoil

New Scientist magazine are running a special feature on climate change this week. Five years on and climate change is looking worse than almost anyone projected. It’s a reasonable article, sure, there is the expected sensationalism (linking Greenland with >1m sea level rise by 2100 for example), but the general message is on the money. From Arctic sea ice through extreme weather, food production and especially human emissions the situation is deteriorating rapidly. Prof. Paul Valdes of the University of Bristol was quoted “Our emissions are not slowing, that’s the most scary aspect of our future.”. Echoing the message From University of Manchester’s Prof Kevin Anderson speaking in Bristol a few weeks ago.

The issue here is that as I read this article, on the New Scientist website, it’s surrounded by no fewer than three large adverts from Statoil. The magazine, possible even this very article is in front of me thanks to Statoil’s marketing budget – which presumably works, or they wouldn’t do it – facilitating their business. And their business in this case? Discovering and extracting new oil reserves. They are advertising for staff with the tag lines “We are looking for engineers who want to go longer, deeper and colder” and “Our megaprojects are waiting for you”. I can only assume they are talking about frontier activities, deep water or Arctic drilling.

Two problems; firstly New Scientist are part of the problem not the solution if they continue to support activities like this, providing their readership to Statoil’s HR department. Secondly, the very activity of prospecting for further hydrocarbon reserves is bankrupt. In the IEA’s World Energy Outlook 2012, published this month, they state that total carbon in known fossil fuels reserves equates to 2860 Gt CO2 if combusted, going on to say less than 900 Gt can be emitted up to 2050 for +2°C world (what they actually mean is a ~50% change of warming being less than 2°C). To put this into context, the World Meteological Organization’s Greenhouse Gas Bulletin (published this week) states 375 billion tonnes of carbon (equivalent to 1375 Gt CO2) has been emitted since 1750 and that approximately 37 Gt are being emitted annually. 24 years of current emissions uses up that 900 Gt budget, but as Valdes points out emissions are still rising with no near term peak in sight shortening this period. As I wrote earlier with regard to North Sea oil and gas “…already discovered reserves of fossil fuels are more than sufficient? If in fact it would be very unwise to burn all the current reserves, why bother looking for more?”.

StatOil

Statoil: Part of the problem

Why are UK gas prices increasing?

The media is full of stories about gas prices today. First British Gas (+8%) then nPower (+8.8%). I’ve two observations:

Firstly, there are lots of price data floating around, but it is all either relative percentage rises or total average household bills. This is the wrong way to think about energy. Gas is priced in pence per kWh. So why doesn’t any of the media coverage actually report the price? It’s almost as if we aren’t responsible for the kWh by kWh consumption, instead we’re just lumbered with an annual bill.

Secondly, there’s very little talk of the reason for the rises, the real reason. Quite simply it’s that UK production of has peaked in 2000 and started to decline. By 2004 we were no longer self sufficient and became a net importer. Over the last decade production has halved and prices have more than doubled.

These data aren’t shown on the BBC News website, so here they are, compressed into one simple chart:

UK annual gas cost, production and imports.

So what should we be doing about this?

The first priority is the reduce the number of kWh we use, this means reducing the amount of energy used in our homes. The Bristol based Centre for Sustainable Energy has a website full of energy advice here: www.cse.org.uk/pages/energy-advice They also have a freephone energy advice line to call to discuss domestic energy saving. It is very easy to reduce energy consumption by 8%, our bills need not rise.

Climate Danger from Natural Gas

A couple of years ago I wrote a piece (Natural gas, the green choice?) for The Oil Drum looking at the climate change implications of using gas rather than coal. Burning gas to produce electricity produces only around 40% the CO2 emissions of burning coal. However, since methane (CH4) is itself a potent greenhouse gas, its release to the atmosphere without being burnt can quickly compensate for this CO2 advantage against coal. I included this chart to illustrate the point:

On the left, CO2 emissions per kWh for coal and natural gas. On the right, the global warming potential of leaked CH4 expressed as CO2

The key take-away was that if the natural gas leak rate is 3%, the global warming potential of a kilowatt-hour of electricity from gas is equivalent to coal. The details behind the chart are in the original article.

This week the journal Nature has an article (Air sampling reveals high emissions from gas field) presenting measurements from a gas field and suggesting that “Methane leaks during production may offset climate benefits of natural gas.”

Led by researchers at the National Oceanic and Atmospheric Administration (NOAA) and the University of Colorado, Boulder, the study estimates that natural-gas producers in an area known as the Denver-Julesburg Basin are losing about 4% of their gas to the atmosphere — not including additional losses in the pipeline and distribution system.

This figure of 4%, their range is 2.3–7.7% loss, with a best guess of 4%, is well inside the danger zone suggesting gas has similar, if not higher, climate impact as coal.

Most of the gas from this site is produced by “fracking”:

Most of the wells in the basin are drilled into ‘tight sand’ formations that require the same fracking technology being used in shale formations. This process involves injecting a slurry of water, chemicals and sand into wells at high pressure to fracture the rock and create veins that can carry trapped gas to the well. Afterwards, companies need to pump out the fracking fluids, releasing bubbles of dissolved gas as well as burps of early gas production. Companies typically vent these early gases into the atmosphere for up to a month or more until the well hits its full stride, at which point it is hooked up to a pipeline.

Gas is often described as the ‘cleaner’ choice, as a transitional energy source between coal and low-carbon renewables. Gas does burn without emitting the oxides of sulphur (SOx) and nitrogen (NOx), traces of mercury, selenium and arsenic, as well as the particulates associated with coal and doesn’t leave the non-combustible slag. Despite this it is increasingly unclear that gas has a significantly lower climate impact and the fracking process itself is not as clean as conventional gas extraction.

North Sea Oil, DECC and Climate Change

This week DECC (that’s the UK Government’s Department for Energy and Climate Change) opened the 27th round of offshore petroleum licensing. This is a process of offering licences for offshore oil and gas exploration and production in the UK administered part of the North Sea.

photo: Creative Commons / Genghiskhanviet

The associated press release described this as “new opportunities for UK oil and gas exploration” … which “ensures the UK gets maximum benefit from our resources.” The Energy Minister Charles Hendry said “With around 20 billion barrels of oil still to be extracted, the UK Continental Shelf has many years of productivity left.”

Given the UK’s commitment to carbon dioxide emission reductions and the global agreement to limit warming to 2°C, do we need to spend time, money and energy exploring for more oil and gas to extract from the North Sea? If the limits imposed by the Earth system and our political system’s response establish a total amount of future emissions, isn’t it quite likely that existing, already discovered reserves of fossil fuels are more than sufficient? If in fact it would be very unwise to burn all the current reserves, why bother looking for more? George Monbiot made a similar point as the Government were approving new coal mines: Leave It In The Ground

It strikes me as odd, that neither the press release nor any of the other documentation associated with this new licensing phase even mentions the carbon dioxide emissions associated with the production and inevitable combustion of the newly discovered oil and gas they are hoping for. This omission leaves DECC looking schizophrenic, with one hand attempting to meet onerous emission reductions whilst the other simultaneously desperately scratches out the last remaining fossil fuels available.

Bicycle Maintenance

Bicycles are great. I ride mine almost every day. To the office, around town, in the countryside, to the allotment, with friends or on my own. The sad truth however, is that an awful lot of people who could ride bikes, don’t. In the UK only 2% of journeys are made by bicycle, compared with 9% in Sweden, Finland and Germany and 25% in the Netherlands (Bassett et al. Journal of Physical Activity and Health, 2008). Along with our lacklustre use of renewable energy, our cycling rates are also languishing at the bottom of the European table. I’d like, and expect, to see more people riding as energy prices rise, the economy continues to struggle and environmental pressures (both local and global) increase. A five-fold increase sounds incredible, but would only equal what many other European countries are already doing, and still represent only half the amount of cycling the best countries manage. It is achievable.

In April last year I spent two weeks in Lincolnshire with Alf and Teresa Webb at The Bike Inn completing my City & Guild’s qualifications in Cycle Mechanics.

Two weeks at The Bike Inn, Lincolnshire

City & Guilds Level 1& 2 Cycle Mechanics (3902) and The Bike Inn ‘Certificate of Attainment’

Since completing the training I’ve been working with Ross Taylor of Taylored Cycles offering the award winning Bristol University Cycle Surgery to staff and students and volunteering with The Bristol Bike Project.

Bristol University Cycle Surgery

Bristol University Cycle Surgery

The Bristol Bike Project also won an award. We won the Grassroots category of the 2011 Observer Ethical Awards and here’s the video:

Tools are important and I now have a fairly comprehensive toolbox. I’ve also recently built a bicycle wheel truing stand, more details here: bicycle wheel truing stand for building and repairing wheels. The only tools I’m still lacking are for the headset (press, remover, star nut fitter…), frame preparing tools (bottom bracket taps, crown race cutter) and the all important workstand!

This year I’m venturing into the world of frame building, with a one week course, again in Lincolnshire with Dave Yates and another with the soon to be opened Bicycle Academy. I say soon to be opened as they are currently setting up their workshop following a fantastically successfully crowd funding. They succeeded in raising over £40,000 in under a week though the new peoplefund.it project.

Watch this space for my adventures in frame building!

Hat tip, James, Bristol Bike Project 🙂

A Lot of Hot Air? David Mackay Fudges the Figures in Favour of Nuclear Power

Last week I had the opportunity to attend a lecture at the University of Bristol’s Cabot Institute given by Prof. David MacKay, chief scientific adviser to DECC (UK Government Department for Energy and Climate Change). There were two main focuses of his lecture: firstly, a discussion of various sources of energy and secondly, an introduction to DECC’s 2050 pathways tool.

The pathway tool I like and I would encourage anyone interested in the UK’s future energy system and associated carbon emissions to have a play with it. All I would say is that, like many scenario analyses, it is too narrow. The whole point of carrying out scenario analysis is to explore the possibility space. The DECC tool assumes both population and GDP growth. These parameters may be “out of the scope of consideration”, but I would have liked the energy and emissions tool to allow the exploration of steady-state and also economic contraction scenarios. I got the impression MacKay would also have liked to include this flexibility but he said Westminster wouldn’t allow it.

I did not like his comparison of energy sources though. He promotes the use of a single metric to compare energy sources: power density. This means the amount of power delivered per unit area, expressed in watts per square meter [W/m2]. The lecture focused on wind and nuclear power but the analysis can be done for solar power, energy crops, or fossil fuelled power stations.

The headline results were that wind has a power density of 2.5 W/m2 whereas nuclear delivers 1000 W/m2. Sounds good for nuclear and not so good for wind! But the difficulty is that MacKay is comparing apples and oranges.

In order to compare things quantitatively as MacKay is attempting to, it helps if units are the same. MacKay’s m2 of wind farm are not the same as his m2 of nuclear power station. There are three main problems with this analysis:

  • Layering
  • Time
  • Externalities

Layering

Cows under Wind Turbines

Cows in a wind farm

The square km of land underneath a nuclear power station is 100% used up. There is nothing else that land can be used for. However, with many renewables the land isn’t used up in a comparable way. Solar panels can be installed on the top of existing buildings requiring none of the underlying land to be used up. Wind farms use around 5% of the land under the turbines, leaving the remaining 95% available for other uses (such as livestock or crops). This 5% compared to 100% improves the power per unit area of wind turbines by a factor of 20.

Time
MacKay made no allowance for the time dimension. He just divided the power of a wind farm or power station by its area. This fails to consider that the nuclear power station took at least 10 years to build before its ~40 year generating lifespan, followed by a ~100 year decommissioning period. In contrast, the wind turbines are generating within months of build commencing and decommission can be similarly swift. This results in the nuclear power station using up the land for around three times longer than the period of time it is generating for, which effectively reduces its power per unit area by a factor of three.

Externalities
MacKay also made no allowance for the land requirements outside the perimeter fence of ether the nuclear power station or wind farm. This discounts the land required for the uranium mine, the uranium processing, the water required for cooling and importantly the waste storage. The wind turbines also required an iron ore mine, steel foundry and factory. I am not able to quantify the differences in land requirement but I expect the nuclear power station’s “invisible footprint” to be larger, especially when multiplying up the area used for waste storage by the duration for which the land is required (potentially many thousands of years) as described above. Finally, nuclear power stations have a non-zero probability of catastrophic failure, then requiring exclusion zones of hundreds of km2 for decades (Chernobyl, Fukushima).

A Comparable Analysis?
A comparable analysis would consider the fractional land use (layering) of an energy source, the total duration for which this land was used (time) and the land required beyond the immediate installation (externalities). That MacKay’s analysis doesn’t consider these aspects, and that they impact the final results by many factors suggests to me that this metric of comparison is oversimplified. I do not object to the use of the power density metric but would like to see it done properly; otherwise it is comparing apples and oranges and is not useful information.

I don’t doubt that MacKay has considered the points raised above. I am worried that the seemingly-deliberate omission of these factors is presenting an overly political bias towards one source of energy.

According to the above back-of-the-envelope estimates, I would therefore amend MacKay’s comparison of nuclear (1000 W/m2) and wind (2.5 W/m2) to the more realistic 300 W/m2 (accounting for time) and 50 W/m2 (accounting for layering). These adjustments reduce the difference between nuclear and wind from 400- to 6-fold. A further unquantified adjustment to account for externalities is likely to reduce this still further.

Of course, in the final analysis the total land area that is needed is reflected by the naive energy densities MacKay calculates – to generate most of our power from wind (or solar, or biomass) would indeed require vast proportions of the countryside or sea surface to be utilised, and this is an important consideration. However, given the above considerations, it is clear that the headline numbers MacKay is promoting are unfair to renewables, and overly generous towards nuclear.

Coalition of the Willing

Back in December, after the Copenhagen climate conference I wrote a quick post about China’s awkwardness. I suggested a ‘coalition of the willing’ comprising of those governments that were willing to make emission reductions should just get on with it, without the rogue states.

Today I’ve come across Coalition of the Willing, a fantastic little film about addressing climate change without the illusive unanimous agreement between governments.

Coalition Of The Willing from coalitionfilm on Vimeo.

‘Coalition of the Willing’ is a collaborative animated film and web-based event about an online war against global warming in a ‘post Copenhagen’ world.

‘Coalition of the Willing’ has been Directed and produced by Knife Party, written by Tim Rayner and crafted by a network of 24 artists from around the world using varied and eclectic film making techniques. Collaborators include some of the world’s top moving image talent, such as Decoy, World Leaders and Parasol Island.

The film offers a response to the major problem of our time: how to galvanize and enlist the global publics in the fight against global warming. This optimistic and principled film explores how we could use new Internet technologies to leverage the powers of activists, experts, and ordinary citizens in collaborative ventures to combat climate change. Through analyses of swarm activity and social revolution, ‘Coalition of the Willing’ makes a compelling case for the new online activism and explains how to hand the fight against global warming to the people.

To find out all about the project and to join our Facebook page, follow us on Twitter, or get the iPhone App visit:
http://coalitionofthewilling.org.uk/

New UK Energy Minister and the Continuing Decline in Energy Production

This post was first published on The Oil Drum. Read there for comments.

The UK Department of Energy and Climate Change (DECC) published their quarterly Energy Trends document last week. It covers up to the first quarter 2010. The key points:

  • Total energy production in Q1 2010 was 6.5% lower than in the first quarter of 2009.
  • Oil production fell by 6% compared to the first quarter of 2009.
  • Natural gas production was 9% lower compared with the first quarter of 2009. The UK was a net importer of gas in the first quarter of 2010 by 155 TWh compared with 106 TWh in the first quarter of 2009.
  • Coal production was 12.5% lower than a year earlier.
  • Nuclear’s supply increased by 1% on the first quarter of 2009.
  • Wind, hydro and other renewables supplied 6.5% less electricity than in the same period last year, with hydro down 44% as a result of less rainfall.
  • Final energy consumption rose by 4% between the first quarter of 2009 and the first quarter of 2010, with rises in all sectors except transport which fell mainly due to the adverse weather conditions.
  • Gas demand was 13% higher than a year earlier.
  • Electricity consumption was 2.5% higher in the first quarter of 2010 compared to the same period last year.

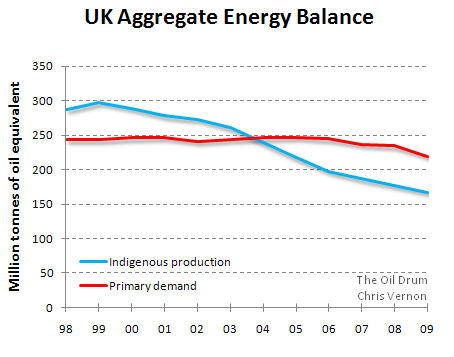
It’s a familiar story: every year the UK’s primary energy production declines significantly. Today, primary energy production is almost half what it was at the peak just a decade ago. Has any other country, let alone major economy experienced such a speed and magnitude shift in its energy system outside wartime?

The rises in the demand data above are largely due to the colder winter and a degree of recovery from the recession. One could argue the decline in indigenous production played a role in the recession. If it did, I suggest it was a small role.

UK Energy
Data from DUKES 1.1-1.3.

The annual energy deficit in 2008 was 57.5 million tonnes of oil equivalent (mtoe). That’s a lot of energy to import. The breakdown of this deficit in 2008 was 42% coal, 36% gas and 19% oil. Let’s just make a quick estimation on how much this is costing:

Fuel Percentage Deficit (mtoe) 2008 Cost/toe (£) Total Cost (£bn)
Coal 42% 24.15 115 2.77
Gas 36% 20.70 191 3.95
Oil 19% 10.92 287 3.14
Total 9.86

UK Energy Deficit 2008. Energy data from DUKES 1.1-1.3. Prices from QEP 3.2.1.

In 2008 the gap cost the UK approximately £10 bn. Fuel prices were a little lower in 2009 (especially coal and gas at -17% and -15% respectively) and the recession closed the gap from 57.5 to 53 mtoe. A few years ago the energy sector was a net source of income for the UK. No longer. The government deficit and the growing debt is receiving the media attention, this energy deficit, now it its fifth year remains largely ignored.

Following the May election, the UK now has a new Energy Minister:

Chris Huhne
Chris Huhne MP, Secretary of State for Energy and Climate Change.

On the 24 June 2010, Huhne gave a speech to the Economist UK Energy Summit, it can be watched here: VIDEO

Did he address the chart above, our energy deficit in the same way chancellor George Osborne had addressed the fiscal deficit in his emergency budget earlier in the week? Well no, not directly. Economic recovery, energy security and climate stabilisation were identified as the key challenges. He isn’t a politician to question growth but did address the type of growth. “…dependence on fossil fuel would be folly. It would make us vulnerable to oil price spikes and volatility.” He called for a decarbonised economy stimulating growth and delivering on climate change and energy security. Sounds good but surely it is having one’s cake and eating it?

After stressing the urgency and seriousness of climate change Huhne addressed energy security. “It is vital we make the most of our domestic oil and gas assets…” indicating at least 20 billion barrels oil equivalent remain in UK waters and that we must continue to invest in exploration. His first mutually exclusive objective of delivering growth through decarbonising is now joined by his second of addressing climate change whist continuing to explore for new fossil fuel resources.

£200 bn of energy investment was said to be needed over the next decade, largely to replace existing assets. On new nuclear, Huhne stressed it will go ahead, but only if it can do so with no public subsidy. In my opinion this all but rules out nuclear as there is little precedent for wholly privately funded nuclear, but we shall have to wait and see. Whatever happens, it will be late with respect to the decommissioning schedule of the existing fleet of nuclear power stations.

Efficiency was described as the fourth energy resource (relegating nuclear and renewables to 5th and 6th?)–the cheapest way of closing the energy gap between demand and supply – “the Cinderella of the energy ball”. Smart meters and grids received a nod but he focused mainly on the existing aged housing stock. “Most of the homes in use in 2050 have already been built … we used more energy heating our homes than Sweden, where average January temperatures are 7 degrees Celsius lower than ours.” Addressing existing homes will be Huhne’s flagship programme. He’s talking about insulating millions of homes. It seems the improvements will be funded at least in part through the energy savings and recovered directly from household utility bills.

“The era of cheap energy is over. …tomorrow’s energy bills will undoubtedly be higher”

When asked about the lights going out, he ruled out wind and nuclear coming to the rescue due to the timeframe, but he stated gas fired power stations can be built in 18 months and assured us the lights wouldn’t go out on his watch. Carbon capture and storage (CCS) was described as vital to meeting climate objectives whilst keeping the lights on.

So in summary, Huhne didn’t address the fundamental peaking of energy supplies which surely should be the key driver for national energy policy today. The inconsistencies of shooting for growth whilst reducing energy use along with addressing climate change (by which I can only assume he means reducing carbon emissions) while encouraging future exploration for oil and gas are glaring. Meinshausen et. al. showed in their Nature paper last year the world has more than enough proved fossil fuel reserves already from a climate change point of view without having to discover more. His enthusiasm for CCS is also worrisome and I would see as largely incompatible with energy peaking scenarios. His focus on energy efficiency and especially domestic energy use is positive though. However there was no mention of transport at all.

New government, new minister but we still seem little closer to recognising the challenges ahead.