Leek and Goats’ Cheese Quiche

Quiche

Leek and Goats' Cheese Quiche.

The Pastry

  • 110 g plain flour
  • 50 g butter
  • 25 g goats’ cheese
  • pinch of salt

The Filling

  • 350 g leeks
  • 175 g goats’ cheese
  • 3 eggs
  • 200 ml crème fraîche (or double cream)
  • 4 spring onions
  • Salt and pepper

1. Make the pastry: sift the flour and salt into a bowl, mix in the butter with fingertips, grate in the goats’ cheese, sprinkle on a tbs or so of cold water and bring the dough together with a knife. Put it in a plastic bag and put it in the fridge for half an hour.

2. Heat oven to 190ºC, fan-assisted 170ºC. Grease a 20cm quiche tin maybe add baking parchment.

3. Chop the leeks and gently fry in butter for 10-15 minutes, add a bit of salt.

4. Whisk the eggs in a jug.

5. Roll out the pastry and line the tin. I had a little left over so I made two small tarts as well.

6. Prick the pastry to let any air out when cooking, brush with a little egg and pop into the oven for 20-25 minutes.

7. With the leeks off the heat in a bowl, having drained any excess liquid, crumble in the goats’ cheese.

8. Add the crème fraîche to the eggs, add lots of freshly ground black pepper.

9. Add the leek and cheese mixture to the pastry, sprinkle chopped spring onion on top.

10. Gently and slowly pour the egg mixture over the leeks.

11. Back into the oven for 30-35 minutes until golden brown on top.

12. Let it rest for 10 minutes before serving.

Quiche

Leek and Goats' Cheese Quiche.

Allotment Update No. 1

Erica and I received the key to our new allotment this week. It’s new not only to us but also to allotmenting in general by the looks of it, with no evidence of previous cultivation. It’s around 8m by 30m and currently just grass with a smattering of thistles and nettles. It runs east-west on a slightly south sloping site.

Allotment

Initial condition - 16th July 2010.

First job has been to hack back the foliage so we can get to the ground to dig the beds. Size and shape of beds is currently under discussion – any ideas?
Allotment

8 meter square cleared, ready to be dug.

The one crop we should get this year is blackberries!
Allotment

This year's blackberries.

New UK Energy Minister and the Continuing Decline in Energy Production

This post was first published on The Oil Drum. Read there for comments.

The UK Department of Energy and Climate Change (DECC) published their quarterly Energy Trends document last week. It covers up to the first quarter 2010. The key points:

  • Total energy production in Q1 2010 was 6.5% lower than in the first quarter of 2009.
  • Oil production fell by 6% compared to the first quarter of 2009.
  • Natural gas production was 9% lower compared with the first quarter of 2009. The UK was a net importer of gas in the first quarter of 2010 by 155 TWh compared with 106 TWh in the first quarter of 2009.
  • Coal production was 12.5% lower than a year earlier.
  • Nuclear’s supply increased by 1% on the first quarter of 2009.
  • Wind, hydro and other renewables supplied 6.5% less electricity than in the same period last year, with hydro down 44% as a result of less rainfall.
  • Final energy consumption rose by 4% between the first quarter of 2009 and the first quarter of 2010, with rises in all sectors except transport which fell mainly due to the adverse weather conditions.
  • Gas demand was 13% higher than a year earlier.
  • Electricity consumption was 2.5% higher in the first quarter of 2010 compared to the same period last year.

It’s a familiar story: every year the UK’s primary energy production declines significantly. Today, primary energy production is almost half what it was at the peak just a decade ago. Has any other country, let alone major economy experienced such a speed and magnitude shift in its energy system outside wartime?

The rises in the demand data above are largely due to the colder winter and a degree of recovery from the recession. One could argue the decline in indigenous production played a role in the recession. If it did, I suggest it was a small role.

UK Energy
Data from DUKES 1.1-1.3.

The annual energy deficit in 2008 was 57.5 million tonnes of oil equivalent (mtoe). That’s a lot of energy to import. The breakdown of this deficit in 2008 was 42% coal, 36% gas and 19% oil. Let’s just make a quick estimation on how much this is costing:

Fuel Percentage Deficit (mtoe) 2008 Cost/toe (£) Total Cost (£bn)
Coal 42% 24.15 115 2.77
Gas 36% 20.70 191 3.95
Oil 19% 10.92 287 3.14
Total 9.86

UK Energy Deficit 2008. Energy data from DUKES 1.1-1.3. Prices from QEP 3.2.1.

In 2008 the gap cost the UK approximately £10 bn. Fuel prices were a little lower in 2009 (especially coal and gas at -17% and -15% respectively) and the recession closed the gap from 57.5 to 53 mtoe. A few years ago the energy sector was a net source of income for the UK. No longer. The government deficit and the growing debt is receiving the media attention, this energy deficit, now it its fifth year remains largely ignored.

Following the May election, the UK now has a new Energy Minister:

Chris Huhne
Chris Huhne MP, Secretary of State for Energy and Climate Change.

On the 24 June 2010, Huhne gave a speech to the Economist UK Energy Summit, it can be watched here: VIDEO

Did he address the chart above, our energy deficit in the same way chancellor George Osborne had addressed the fiscal deficit in his emergency budget earlier in the week? Well no, not directly. Economic recovery, energy security and climate stabilisation were identified as the key challenges. He isn’t a politician to question growth but did address the type of growth. “…dependence on fossil fuel would be folly. It would make us vulnerable to oil price spikes and volatility.” He called for a decarbonised economy stimulating growth and delivering on climate change and energy security. Sounds good but surely it is having one’s cake and eating it?

After stressing the urgency and seriousness of climate change Huhne addressed energy security. “It is vital we make the most of our domestic oil and gas assets…” indicating at least 20 billion barrels oil equivalent remain in UK waters and that we must continue to invest in exploration. His first mutually exclusive objective of delivering growth through decarbonising is now joined by his second of addressing climate change whist continuing to explore for new fossil fuel resources.

£200 bn of energy investment was said to be needed over the next decade, largely to replace existing assets. On new nuclear, Huhne stressed it will go ahead, but only if it can do so with no public subsidy. In my opinion this all but rules out nuclear as there is little precedent for wholly privately funded nuclear, but we shall have to wait and see. Whatever happens, it will be late with respect to the decommissioning schedule of the existing fleet of nuclear power stations.

Efficiency was described as the fourth energy resource (relegating nuclear and renewables to 5th and 6th?)–the cheapest way of closing the energy gap between demand and supply – “the Cinderella of the energy ball”. Smart meters and grids received a nod but he focused mainly on the existing aged housing stock. “Most of the homes in use in 2050 have already been built … we used more energy heating our homes than Sweden, where average January temperatures are 7 degrees Celsius lower than ours.” Addressing existing homes will be Huhne’s flagship programme. He’s talking about insulating millions of homes. It seems the improvements will be funded at least in part through the energy savings and recovered directly from household utility bills.

“The era of cheap energy is over. …tomorrow’s energy bills will undoubtedly be higher”

When asked about the lights going out, he ruled out wind and nuclear coming to the rescue due to the timeframe, but he stated gas fired power stations can be built in 18 months and assured us the lights wouldn’t go out on his watch. Carbon capture and storage (CCS) was described as vital to meeting climate objectives whilst keeping the lights on.

So in summary, Huhne didn’t address the fundamental peaking of energy supplies which surely should be the key driver for national energy policy today. The inconsistencies of shooting for growth whilst reducing energy use along with addressing climate change (by which I can only assume he means reducing carbon emissions) while encouraging future exploration for oil and gas are glaring. Meinshausen et. al. showed in their Nature paper last year the world has more than enough proved fossil fuel reserves already from a climate change point of view without having to discover more. His enthusiasm for CCS is also worrisome and I would see as largely incompatible with energy peaking scenarios. His focus on energy efficiency and especially domestic energy use is positive though. However there was no mention of transport at all.

New government, new minister but we still seem little closer to recognising the challenges ahead.

Natural gas, the green(er) choice?

This post was first published on The Oil Drum. Read there for 100+ comments.

Natural gas is regarded as a relatively environmentally friendly way of generating electricity. Gas burns cleanly without many of the problems associated with coal. Coal is a chemically complex substance. When it is is burnt, it releases oxides of sulphur (SOx) and nitrogen (NOx), traces of mercury, selenium and arsenic, as well as particulates, and a non-combustible slag remains after burning. Coal mining is also a dirty and dangerous job.

Coal emits considerably more CO2 than natural gas per unit energy. However, natural gas (CH4) itself is a potent greenhouse gas, and its release to the atmosphere without being burnt can quickly compensate for the CO2 advantage against coal.

Generating electricity from fossil fuels typically involves their combustion in large power stations. Due to the molecular differences of coal, oil and gas, different amounts of carbon dioxide are produced for each unit of thermal energy. For example, the EIA tells us coal (anthracite) releases 227 pounds of CO2 per million BTU (or 351 g/kWh thermal), fuel oil or diesel 161 lb/MBTU (249 g/kWh) and natural gas releases 115 lb/MBTU (178 g/kWh). This, coupled with the variability in power station thermal efficiency leads to significant variations in the amount of CO2/kWh of electricity emitted.

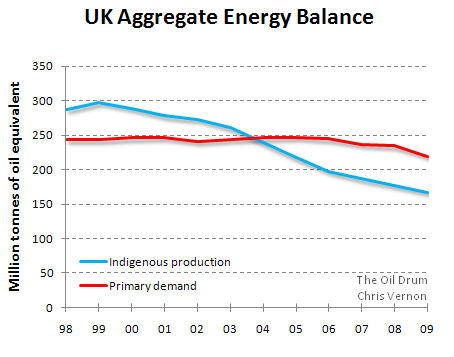
The figures below are for the UK electricity grid.


This table was lifted from: http://electricityinfo.org/co2emissions.php

These CO2 emissions are directly related to the fossil fuel combustion and power station efficiency. Lifecycle emissions are not included, leaving nuclear and renewables at zero, because emissions related to construction, decommissioning, uranium processing etc. are ignored. Natural gas is considered the ‘greener’ fuel as electricity from gas emits 2.5 times less CO2 than coal, as well dramatically lower CO, NOx and virtually no SOx or particulates.

There is an issue of system boundaries here. The figures above only consider the power station and not any upstream supply system. While CH4 may leak from the gas pipelines, there are also CH4 releases from coal mines. For this post, let’s consider emissions after the mine mouth or well head, and ignore emissions associated with transporting coal.

For oil and coal, the only significant route into the atmosphere is via combustion. However, besides being burnt, natural gas can be released without combustion as methane, CH4. This becomes interesting when one considers both the impact of atmospheric emissions of CO2 and CH4. Both are greenhouse gases in that they that absorb and emit radiation within the thermal infrared range of the electromagnetic spectrum, however their respective radiative forcings are very different. The radiative forcing measures how much a greenhouse gas (or other factors) alters the balance of incoming and outgoing energy in the Earth-atmosphere system.

The Carbon Dioxide Information Analysis Center (CDIAC) part of the US Dept. of Energy uses Global Warming Potential (GWP), as it provides a simple measure of the radiative effects of emissions of various greenhouse gases, integrated over a specified time horizon and relative to an equal mass of CO2 emissions. Over a common 100 year time horizon CDIAC state the global warming potential of CH4 as 25 times greater than CO2 [link]. The calculation is not trivial, and estimations do vary a little, but for this analysis the factor 25 is sufficient.

We saw above that natural gas emits 2.5 times less CO2 than coal when used to generate electricity. However, when CH4 is released to the atmosphere without first being combusted, the global warming potential is 25 times higher than CO2. It is a more potent greenhouse gas. If only a little natural gas is released without being burnt, it will dominate the radiative forcing and more than compensate for the 2.5-fold advantage gas has over coal.

The chart illustrates this effect:


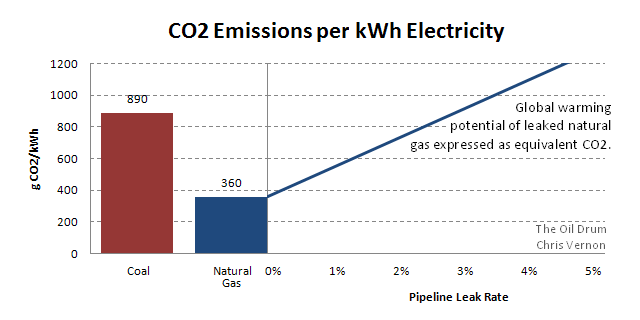
On the left, CO2 emissions per kWh for coal and natural gas. On the right, the global warming potential of leaked CH4 expressed as CO2

If the natural gas leak rate is 3%, the global warming potential of a kilowatt-hour of electricity from gas is equivalent to coal.

Leak Rates

So what are pipeline leak rates? A 1997 US Environmental Protection Agency report states US methane leak rates were 1.4 +/- 0.5 % in 1992. The largest source of leakage at that time was compressor components used in the processing, transmission, and storage, followed by the distribution network itself, with the small length of old cast iron pipes leaking disproportionately highly. The natural gas production process also contributes through millions of slowly leaking pneumatic control devices. A larger study carried out from 2005 by Brazil’s largest gas distributer Comgas suggests cast iron pipe leak rates double the EPA study.

A 1990 study for Greenpeace considered the UK distribution network then operated by British Gas. Greenpeace estimated low, medium and high scenario leakage rates of 1.9%, 5.3% and 10.8% respectively. This was in contrast to the 1% claimed by British Gas at the time. The authors were confident leakage rates were above 1.9%. These figures are likely obsolete today as there still existed a large amount of pre-1970 cast iron pipe work, much of it since replaced. In 1990 only 39% of the UK mains and 74% of the service pipes were plastic.

The 1.4% figure is also old, and only refers to the US, but it is a significant magnitude, it represents a 70% increase in global warming potential compared to the CO2 alone and halves the CO2 advantage gas has over coal based on the 360 and 890 g/kWh figures above.

Whilst these figures do not tip gas beyond coal, they halve its advantage. They are also only national. For the US this is quite understandable, but for the UK and Europe, the gas system is changing. Could leak rates become important as natural gas supply routes become longer? As Europe increases its reliance on Russia, as previously stranded gas is brought to market through longer pipelines than before, as a larger number of smaller deposits are exploited and as existing infrastructure ages, it seems likely that leak rates will increase. We often hear about struggles in the former Soviet states related to gas – is the leak rate there one percent or five? Is it economically feasible for the pipeline operator to make investments to stem the last percentage point of a system’s leaks?

Is it possible that a ‘green’ gas power station in the UK is making a greater contribution to global warming than one burning coal?

Does anyone have recent data on leakage rates, especially for Russia and Eastern Europe?

Swashbuckler 2010 Race Report

Ten minutes to go!

On Sunday 23rd May I competed the 2010 Swashbuckler triathlon. At 1.9km swim, 80km bike and 22km run it is approximately a half Ironman distance race. The venue was the beautiful Buckler’s Hard historic village, in the New Forest. With registration on the Saturday and a 6:15am start we had to stay local. We camped at the Roundhill campsite which is probably the closest and with a couple dozen triathletes staying had arranged some ‘triathlon’ parking to facilitate our pre-dawn departure.

We arrived on site nice and early, the atmosphere was tense as everyone unpacked bikes, fussed over their transition layout, walked the few hundred metre run up from the water’s edge to their bike. Not a breath of wind and clear skies. The air temperature was around 11 °C and there was a thin mist over the balmy 16 °C water of the tidal Beaulieu River. This would only be my 2nd open water swim of the year, first completive mass start and first swim in any kind of current. As the ~400 competitors slipped into the water I ‘self seeded’ myself towards the back. This was probably a mistake as no sooner had I stepped into the water, still some 100 m from the start line the horn sounded and we were off!

Mass start

The swim consisted of two clockwise laps, with a cut-off time of one hour. By the time I had made it to the turn around buoy my watch said almost 20 minutes, I wasn’t going to make it at this pace! Missing the start and the incoming tidal stream was killing me. Luckily the return leg only took 10 minutes with the flow. The second lap was a little better 15 minutes out to the buoy, the only demoralising point was seeing the half dozen swimmers who turned back before the buoy… Another 10 minutes back with the flow and I was out of the water inside the cut-off, but not by much! Richard the race organiser was on the bank up to his knees making sure everyone got out okay and offering plenty of encouragement. 358th of the 390 to leave the water, the 92nd percentile, ouch.

Transition

By the time I got to transition most of the bikes were gone. I took my time, there’s no quick way I know to get compression socks over wet feet! The sun wasn’t hot yet but it certainly would be so a minute slapping on the factor-40 seemed like time well spent. Jogging out of T1, hopping on the bike and I was off. The weather and scenery biking around the New Forest was just superb, it was hard to remember I was meant to be racing rather than just out for a Sunday ride. Relative to the swim, not hard I know, I’m stronger on the bike so gradually started picking people off. The course was pretty flat so most of the time was spend on the aerobars.

We were told in the briefing that the course included a few cattle grids, another first for me, and assured they were fine to ride over. I don’t even like walking over them, this could be fun. Whizzed over first with no drama however on the road there must have been twenty escaped drinks bottles fallen from the riders ahead of me! Half way round and I was looking for a toilet stop. The course runs along a short stretch of beach with stunning early morning views out towards the Isle of Wight. Also a carpark and toilets. Before the stop my average speed had been 18.2 mph, I lost three minutes here and would finish the bike with an 18.0 mph (29 kph) average. My bike split was 291st out of 387 so the 75th percentile.

Half way!

By T2 it was getting hot, around 24-26 °C. I hadn’t done any real running since March where I aborted the Jurassic Coast Challenge 40 miles in with Achilles trouble and I’ve never been good with high temperatures. The 14 mile run was two seven mile laps. I was planning to maintain a steady nine minute mile pace but after four miles my head was a mess I couldn’t do this, too hot. I convinced myself I’d drop out after this first lap. Thankfully at five miles the route left the now blazing hot sun and entered the cool forest. Two miles later, completing the first lap by running up through the village to the cheers of the supports and I was feeling fine again as this photo was taken:

7 miles to go, so hot!

Kept up the nine minute mile pace through to the 9th mile where I let it slip a bit, lost five minutes until realising as I passed the 11 mile point there were three miles to go and 27 minutes left to get home under six hours. This was going to be tough! I managed an 8min 24sec mile and another in 9 minutes and managed to come home with a finishing time of 5hr 59min and 27sec. Done it! My run split ended up being the most competitive despite the heat and not having done any run training for almost two months. I placed 242nd of 371 for the 65th percentile. As I crossed the line I was totally exhausted. The last few miles certainly weren’t fast but were the hardest I’d ever run. I’ve got a lot of training to do!

To anyone thinking to enter this event next year – do it. The organisation is spot on, the venue is simply beautiful and both the run and bike courses are fairly flat. This is a quick course, the winner James Gilfillan, came home in the simply awesome time of 03:52:09.70.

...tired now.

Sadly, competitor Tim Wilks collapsed during the run section of this event and despite the valiant efforts of the competitors around him who administered CPR and the event medical team, it was not possible to revive him. RIP Tim.

More photos here.

Parsnip and Maple Syrup Cake

Parsnips are great, why not in a cake? This was my birthday cake in 2010.

The Cake

  • 175g butter
  • 250 g demerara sugar
  • 100 ml maple syrup
  • 3 large eggs
  • 250 g self-raising flour
  • 2 tsp baking powder
  • 2 tsp mixed spice
  • 250 g parsnips , peeled and grated
  • 1 medium eating apple , peeled, cored and grated
  • 50 g pecans , roughly chopped
  • zest and juice 1 small orange

The topping (or filling)

  • 250 g tub mascarpone
  • 3-4 tbsp maple syrup

1. Heat oven to 180ºC, fan-assisted 160ºC. Grease 2 x 20cm sandwich tins and line the bases with baking parchment. Or just use a loaf tin like I did.

2. Melt butter, sugar and maple syrup in a pan over gentle heat, then cool slightly.

3. Whisk the eggs into this mixture, then stir in the flour, baking powder and mixed spice, followed by the grated parsnip, apple, chopped pecans, orange zest and juice.

4. Pour into the tin(s), and bake for 25-30 mins until the tops spring back when pressed lightly.

5. Cool slightly in the tins before turning out onto wire rack to cool completely.

6. Just before serving, and absolutely when fully cooled, mix together the mascarpone and maple syrup. Spread over one cake and sandwich with the other or just spread on top if only one tin was used and you don’t fancy cutting it in half! If the mascarpone went in the middle, dust with icing sugar before serving.

Parsnip Birthday Cake

Banana, Chocolate and Oat Muffins

I love cooking with oats, banana and chocolate. These muffins are low in fat too, just great!

Ingredients makes ~16 muffins

  • 25 ml vegetable oil
  • 2 bananas, coarsely mashed
  • 1 large egg
  • 250 ml milk
  • 300 g self-raising white flour
  • 100 g rolled oats (plus for more for topping)
  • 150 g caster sugar or soft light brown sugar
  • ½ teaspoon bicarbonate of soda
  • 1 teaspoon cinnamon
  • 50 g dark chocolate finely chopped

1. Heat the oven to 180ºC (fan assisted), I guess a little hotter if not.

2. Beat the egg and mix all the wet ingredients together.

3. Sift the flour, sugar, cinnamon and bicarbonate of soda into a large mixing bowl. Add the oats.

4. Fold in the wet ingredients, mashed banana and chocolate chips. Minimal mixing to preserve air.

5. Spoon the mixture into muffin cases, filling them about two-thirds full. Sprinkle some oats on the top.

6. Bake for 25-30 minutes, or until the muffins have risen and are lightly browned.

In my experience muffin recipes are fairly forgiving. I’ve pretty much made this one up. The banana and chocolate could certainly be replaced with other interesting fruit or some wholemeal flour could be used.

Banana, chocolate and oat muffins

Beetroot Chocolate Cake

Here’s a quite awesome chocolate cake. No butter, lots of fresh (not pickled!!) beetroot gives it a lovely moist texture. It’s healthy too, for a chocolate cake!

The cake

  • 250 g dark chocolate
  • 3 medium eggs
  • 250 g light muscovado sugar
  • 1 teaspoon vanilla essence
  • 2 tablespoons maple syrup
  • 2 tablespoons clear honey
  • 40 g self-raising flour
  • 40 g plain flour
  • 1/4 teaspoon bicarbonate of soda
  • 1/4 teaspoon salt
  • 25 g cocoa powder
  • 50 g ground almonds
  • 250 g raw beetroot, peeled and finely grated
  • 100 ml strong black coffee, optional
  • 30 ml sunflower oil

The topping

  • 150 g dark chocolate
  • 1 teaspoon vanilla essence
  • 3 tablespoons clear honey

1. Heat a conventional oven to 160ºC, or a fan-assisted one to 140ºC. Grease a round 20cm diameter by 8cm high loose-bottomed tin.

2. Melt the chocolate in a bowl over a pan of simmering water until all dissolved, set aside to cool.

3. Beat the eggs with the sugar, vanilla essence, the maple syrup and the honey vigorously for three minutes until pale and quite fluffy.

4. Fold in the flours, bicarbonate of soda, salt, cocoa and ground almonds.

5. Using some kitchen paper, dab the grated beetroot thoroughly to remove some of the excess moisture. Fold in the beetroot, cooled chocolate, (option) coffee and oil until thoroughly mixed together.

6. Pour the mixture into the tin and cook in the middle of the oven for 1 hour 30 minutes. After this time, cover the cake with foil and bake for another 30 minutes.

7. Test the cake by inserting a skewer into the centre to see if it comes out clean (although this cake is so moist that even when the cake is fully cooked, the skewer comes out looking slightly messy). Leave to cool on a wire rack.

8. To make the topping, melt the chocolate gently in a bowl over a pan of simmering water, then remove from the heat and add the vanilla essence and honey.

9. Set aside to cool for at least 15 minutes before icing the cake. Cut the cake through the middle and ice it in the centre (jam?) and on all sides.

And here’s what it should look like!

Beetroot chocolate fudge cake

This recipe is based on: Beetroot chocolate fudge cake

The Perfect Loaf

Well, of course it’s not perfect. But it is the best loaf I’ve made yet in my short bread baking career. A considerable improvement on an earlier loaf shown here. It’s a simple loaf:

150 g strong wholewheat flour
350 g strong white flour
320 ml warm water
10 g sugar
7 g dried yeast
7 g salt

That’s it. Kneaded and left to rise for a good 45 minutes, then a brief second knead and left to rise for half an hour on the tray. Lastly, I slashed the top and sprinkled with a little more wholewheat flour. Cooked at 240 °C for 35 minutes with a tray of water in the bottom of the oven.

Bread

The latest loaf

Exceptional Warmth

It’s been a while since I last posted an interesting chart. Here’s another one. I first came across it in a lecture I attended titled “Ocean Circulation and Climate” given by Helen Johnson last year. The chart was produced by Stefan Rahmstorf, a version is included in the following paper, available on his website:

Rahmstorf, S. and A. Ganopolski, 1999: Long-term global warming scenarios computed with an efficient coupled climate model. Climatic Change, 43, 353-367.

Deviation of the annual mean surface air temperature from its zonal average

Deviation of the annual mean surface air temperature from its zonal average - Rahmstorf (1999)

The provided caption reads:

Deviation of the annual-mean surface air temperature from its zonal average, computed from the NCAR air temperature climatology. Anomalously cold areas are found over some continental regions, anomalously warm areas over ocean deep water formation regions.

The term “zonal average” means the average along a line of latitude. Meridional refers to longitude (think Greenwich Meridian). The chart shows that the average air temperature off Scandinavia is some 10 °C warmer than the average temperature at the latitude (60 to 70 degrees North). NCAR refers to The National Center for Atmospheric Research.

Rahmstorf explains in his paper how this temperature deviation is the result of heat being transported by ocean currents, currents that do vary over time and could be impacted by future climate change. This warming is the result of the thermohaline circulation (THC), driven by global density gradients created by surface heat (thermo) and freshwater fluxes (haline). Variation in the THC could have a dramatic cooling influence in the North Atlantic as climate change impacts both heat and freshwater flux. As far as I am aware though it is not currently possible to measure and model the interactions accurately enough to make confident predictions about the likelihood of the THC being significantly impacted as a result of climate change.

I think this is an interesting chart as it illustrates just how exceptionally warm the North Atlantic and northwestern Europe are for their latitude. The UK for example sits between 50 and 60 degrees North. Within that band we also find the southern tip of Greenland, Vancouver (home of the 2010 winter Olympics), Moscow and the chilly waters of Hudson Bay and the Gulf of Alaska.